Trees
A tree is a more compact representation of a multi-dimensional cube. The cells are calculated in the same way as a cube but the dimensions categories are represented as nodes in the tree.
Tree views may be "collapsible" or "flattened" - selected using the icons .png) or
or .png) on the toolbar.
on the toolbar.
.png "Example Collapsible Tree on Occupation and Source")
Initially the breakdown of cells by the first dimension is displayed. Each cell can be opened by clicking to reveal the breakdown by the second dimension. In this way you can delve into the more interesting areas of the results without being overwhelmed by the number of cells.
A tree may also be transformed to a "flattened" view. This results in all cells being displayed and referenced by their dimension coordinates. This is particularly useful if combined with sorting by the count to reveal the most highly populated cells.
You can add statistics into a tree in the same way as you do a cube. For information on working with statistics, see:
Create a tree
- Drag and drop the Tree tool
.png) from the Toolbox onto an existing selection or onto the FastStats Workspace. If you haven't created your selection first then define your selection on the Selection tab. If no selection is defined then the Tree will be based on the entire record set.
from the Toolbox onto an existing selection or onto the FastStats Workspace. If you haven't created your selection first then define your selection on the Selection tab. If no selection is defined then the Tree will be based on the entire record set. -
If necessary, set the Resolve Table by dragging the relevant System Table onto the text box or right click on the text box and select a table.
.png)
-
Drag the variable(s) you want to see on the Tree onto the drop on boxes.

-
Click the Build
 button to build the Tree.
Select values
You can select information from a Tree for further analysis in one of several ways.
.png "Example Tree with 3 values Selected")
- You can highlight contiguous cells within the Tree by clicking and dragging or by Shift clicking a range of cells.
- You can highlight non-contiguous cells by Ctrl clicking them.
Or alternatively
- You can select cells by their thematic shading by using the slider. Drag the split slider button to the right to increase the selection.
.png)
See also: Thematic shading
Change tree size
A tree may be restricted by a Top N function, the Count/Statistic used or a combination of both.
The following Tree was generated to display Occupation and Income at the People table and with a Mean statistic based upon the Cost variable.
.png)
-
Click on the Tree Size
.png) button on the toolbar.
button on the toolbar. -
Click on the Show Partial Tree radio button.
.png)
You can now restrict the records used by specifying the minimum number of People in a category and/or the Mean(Cost) of each category. Tick the box and enter the minimum value.
To select the Top or Bottom N records tick the Restrict To box enter the number of records to display based upon the statistic selected, which in this example would be People or Mean(Cost).
Filter values
You may want more control over which values are displayed in the Tree. For example, you may wish to filter out certain values from being shown.
As an example, the Tree below shows all Title values shown in the cells.
.png "Example Tree with Source and Title as the dimensions")
To filter the Title Rows:
-
Click on the black arrow beside the variable to change e.g. Title
 .
. -
Choose which items to include or exclude by clicking the relevant Include check-box (the example below shows the "Dr", 'Rev.' "Prof." and 'Lord' Rows being filtered).
.png)
-
Click OK to re-draw the Tree.
.png "Example Tree with filtered Title values")
Use the  button to quickly switch between a filtered and unfiltered Tree.
Save a tree
A Tree will be given the default name of Tree when it is first created. To rename a Tree, simply over type the name in the text box.
.png)
You can save a Tree in the following ways:
-
Click on the icon to the left of the Tree name.
-
Drag and drop the icon onto the appropriate File Explorer folder.
.png)
The saved Tree can then be re-loaded by dragging and dropping the item from the Files explorer window back onto the FastStats workspace.
Alternatively click on the Save icon .png) .
.
.png)
-
Navigate to the folder where you want to save the file.
-
Enter the File name if you haven't already renamed the window.
-
The Save item will be your Tree page or the whole book.
-
Click the Save button to complete the task.
Save as template
FastStats makes it possible to save the settings of a Tree as a template which can be re-used on different selections.
A Tree will be given the default name of Tree when it is first created. To rename a Tree, simply over type the name in the text box.
To save a Tree as a template:
-
Click on the icon to the left of the Tree name.
.png)
-
Drag and drop the icon onto the Templates ribbon bar.
.png)
To make use of a saved Tree template:
- Drag the template you wish to re-use from the Templates ribbon bar and onto the FastStats Workspace, or onto an existing selection. Alternatively drag the selection onto the named template in the Toolbox to run automatically.
Text variables
Unlike selector variables, which have a predefined number of categories a text variable could have an unlimited number of data entries. To make this type of variable of practical use the Tree will give you the opportunity to limit the display to a manageable size.
-
Display the Tree tool and drag the Surname variable on to the first drop on box. Click Play
 .
..png)
By default the system will offer to restrict the display by the Top 1000 Surnames. This can be changed to a lower number or a Bottom N selection. Alternatively you may restrict the number of Surnames by the display value.
-
Untick the Restrict To option and tick the box next to People and type 1000 in the Minimum box.
-
Click OK and Play to see a display of Surnames that have 1000 or more People on the database.
To see more of these options see Change the tree size.
Thematic shading
Thematic shading is a visualisation technique used to highlight the numeric distribution within the Tree result. Thematic shading allows easy and quick interpretation of Tree results. You can control the range of colours used and the method of assigning cell colours based on one of the numeric results.
The default thematic shading option is set to Quantiles with 10 ranges i.e. deciles.
To change the settings for the thematic shading click the .png) menu option to bring up the following menu.
menu option to bring up the following menu.
.png)
The cells can be shaded in the following ways:
- Equal Ranges – each colour is assigned an equal size, consecutive numeric range calculated as the difference between the lowest and highest cell, divided by the number of ranges;
- Mean Split – fixed to two ranges with one colour below the average and one above the average;
- Log Equal Ranges – the difference between the lowest and highest cell with exponentially increasing ranges. Each colour is assigned a consecutive numeric range;
- Top N – highlights the top N cells. All other cells are coloured using the normal background colour;
- Bottom N - highlights the bottom N cells. All other cells are coloured using the normal background colour;
- Standard Deviation – no of standard deviations away from the mean;
- Threshold – above and below a particular value specified in the Threshold setting, fixed to use two colour ranges: one above the threshold and one equal to or below the threshold;
- Absolute Threshold – fixed to use three colour ranges: one below the negative threshold value, one between the negative and positive threshold values and one above the positive threshold value.
The Ranges option lets you specify how many different shades to use when shading the Cube. The default setting is 10.
To turn off thematic shading, choose 'None' from the type list-box.
.png)
To change the colours used for shading:
-
Click on the relevant listbox option.
-
Specify a colour from either the Custom, Web or System tabs.
.png)
You can change the following colour settings:
- Normal is the default colour for a particular cell.
- Low is the shade used for the lowest value cells.
- High is the shade used for the highest value cells.
- Sub Total is the shade for the subtotal column and row.
- Grand Total is the shade for the grand total cell.
- Boundary is the colour used for either the boundary of the entire cube, or for the nested segments if there are multiple variables on either axis.
Custom colours
There are many ways to apply thematic shading to a FastStats tree, helping you to more easily visualise the distribution of records and quickly interpret numeric results. Typically you specify a 'low', 'high' and 'normal' colour and this generates a graduated scale according to the defined bands.
Sometimes, however, you may not want a graduated colour scale and, instead, a non-thematic, 'custom colour' solution is required. Let's take a look at some examples.
Example
Create a tree that displays the source of a person's holiday booking. Use custom colours to indicate whether the average cost of a booking from each source is considered 'bad', 'okay', or 'good'.
- Open a new Tree from the FastStats Toolbox and add the Source variable as a dimension.
- Right drag and drop the Cost variable into the middle of your tree as a measure and select Mean(Cost).
- Open the Statistics dialogue and make Mean(Cost) the primary measure.
- Build the tree.
- Click
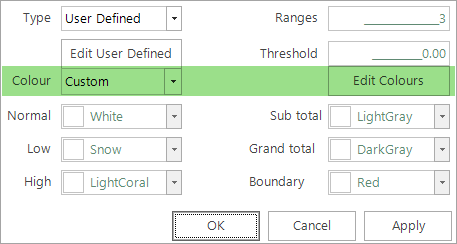
 to open the Thematic dialogue and from the Type drop-down select User Defined then Edit User Defined.
 -
Enter the following bandings and then click OK:
<=640
>=640 - <=650
>650
-
Return to the Thematic dialogue and from the Colour drop-down select Custom and then Edit Colours.
-
In the Choose Category Colours dialogue set the number of bands to 3 and then click on the drop-down next to each banding to select the colours — red for bad, yellow for okay, and green for good.
-
Click OK then Apply and OK — the tree display updates to reflect your defined settings:
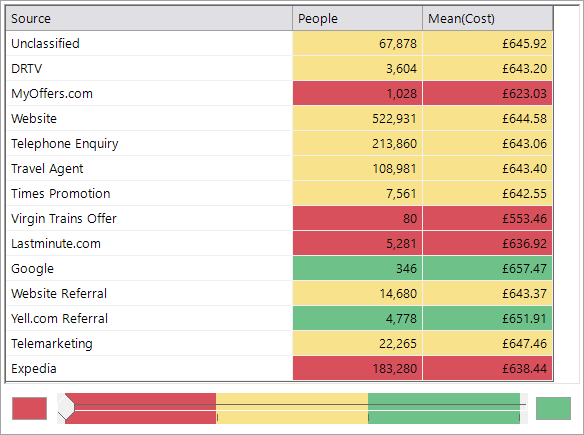
You can now very quickly and easily discern that Google and Yell.com Referral are the sources that represent the higher average cost of holiday bookings.