Calculated measures
This first iteration of Calculated Measures allows Orbit dashboard editors to calculate their own measures to present on visualisations. Being the first release, this version of Calculated Measures comprises of simple operators that allow you to add, subtract, multiply, and divide data variables and/or full counts of system tables together.
There are many benefits of being able to derive results from existing variables but the common case for this entry level calculation capability is ratios. Ratios find proportions such as cost per booking, or average booking per person, so that you can keep tracking key stats that inform whether you are meeting defined KPIs.
If you compare a calculated measure in Orbit with its equivalent calculated in FastStats, then you may see a discrepancy between the two values. This is due to rounding calculation process that occurs in FastStats. The value provided in Orbit is more accurate to a higher level of precision.
Adding a calculated measure to a dashboard
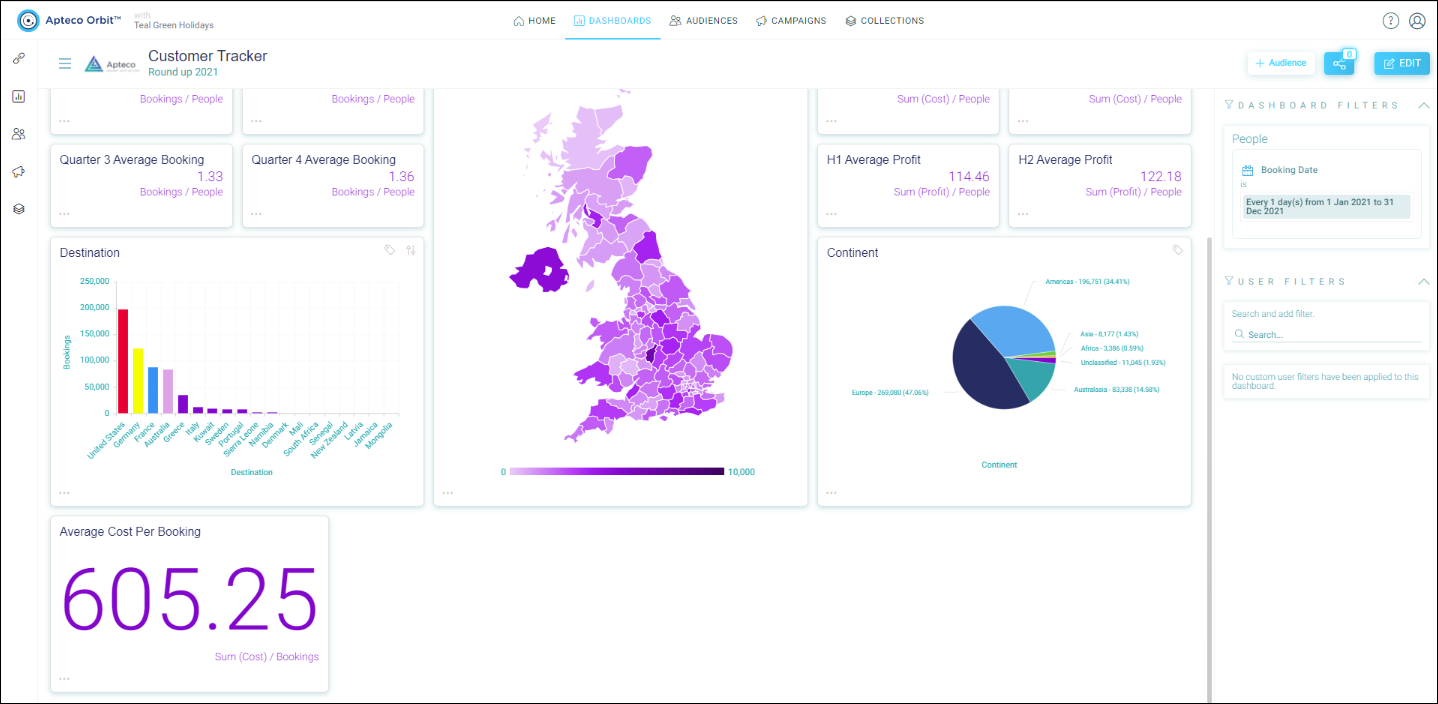
Calculated Measures functionality is available on all dashboard visualisations. However, in its current form it is most suitable for displaying headline figures on the number card.
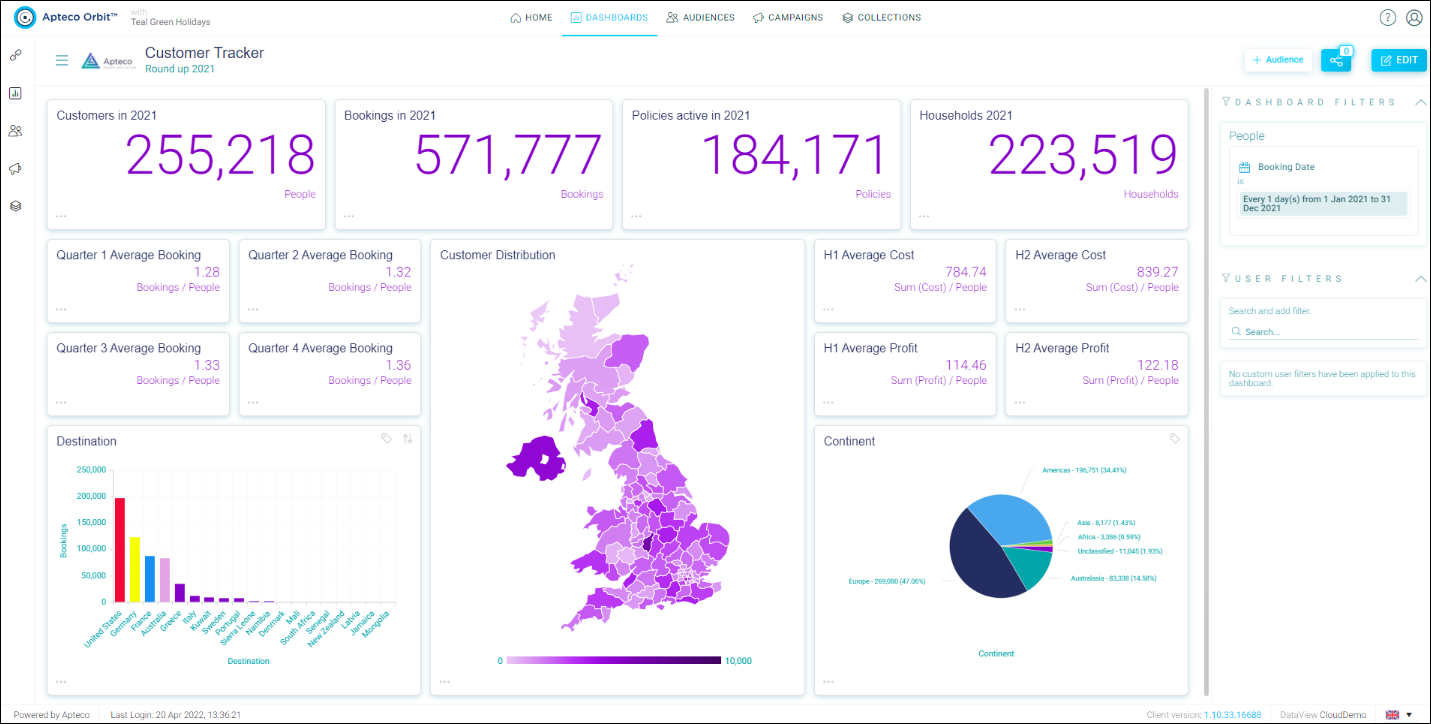
As with all dashboard features, adding or amending begins with editing a Dashboard. In this example a new tile is added but Calculated Measures can be applied to an existing Dashboard tile by deleting the existing measure, ready to add a new Measure in its place.
Note
Calculated measure values may differ between FastStats and Orbit. This is due to rounding calculation process that occurs in FastStats. The value provided in Orbit is more accurate to a higher level of precision.
To add a new tile applying calculated measures:
-
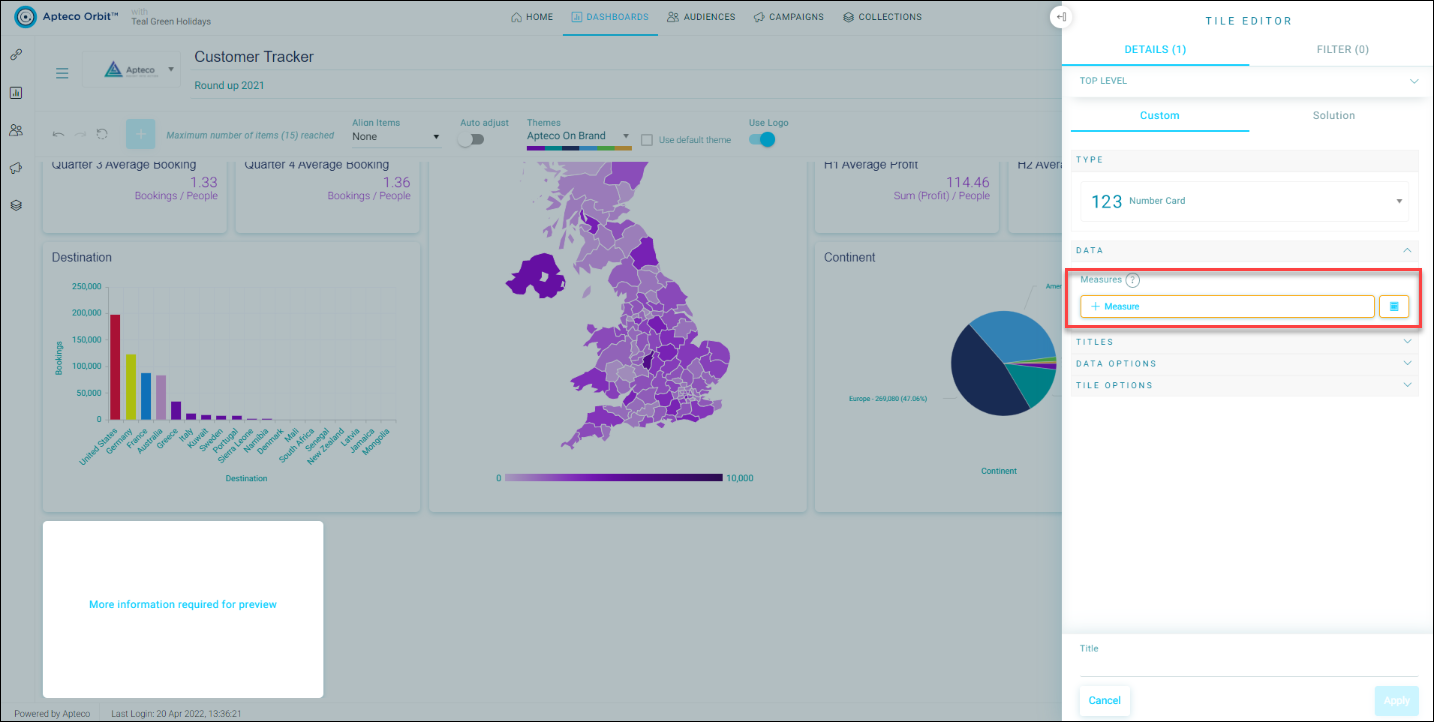
Rather than choosing the + Measure option, click on the Calculated Measures icon on the right hand side of + Measure.

-
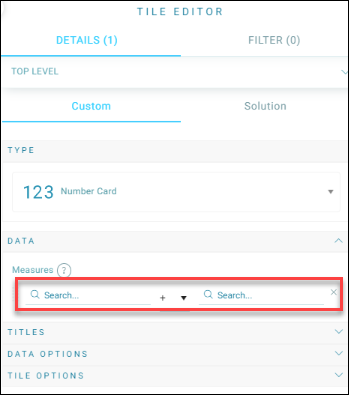
By selecting this icon, you can choose two measures to be applied together to form one resultant Measure.
-
Click on the Search data fields to add either a data variable or a table to the Measure.
-
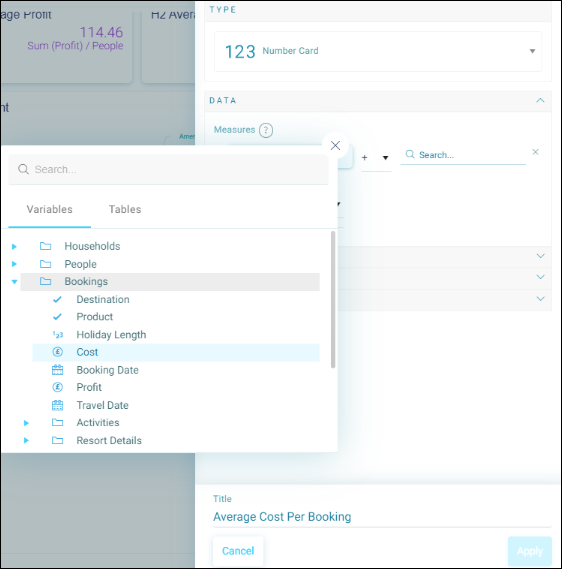
Choose the appropriate operator: add, subtract, multiply, or divide by selecting the drop down menu in between the two Measures.
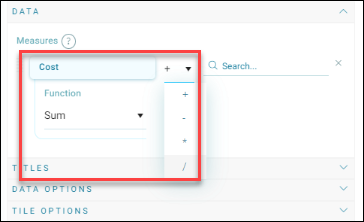
-
Then search or select the data table or variable you wish to use for the second Measure in the calculation. You can choose to show the result of the calculation as a percentage by placing a tick in the Show as a Percentage option.
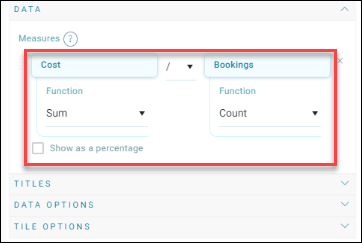
Note
When adding a measure or calculated measure to a visualisation, you can choose to display its labels with decimal places ranging from 0 to 2.
-
Once the Calculated Measure has been created, carry on amending the other Tile options as appropriate, and give the tile a name to enable the Apply button.
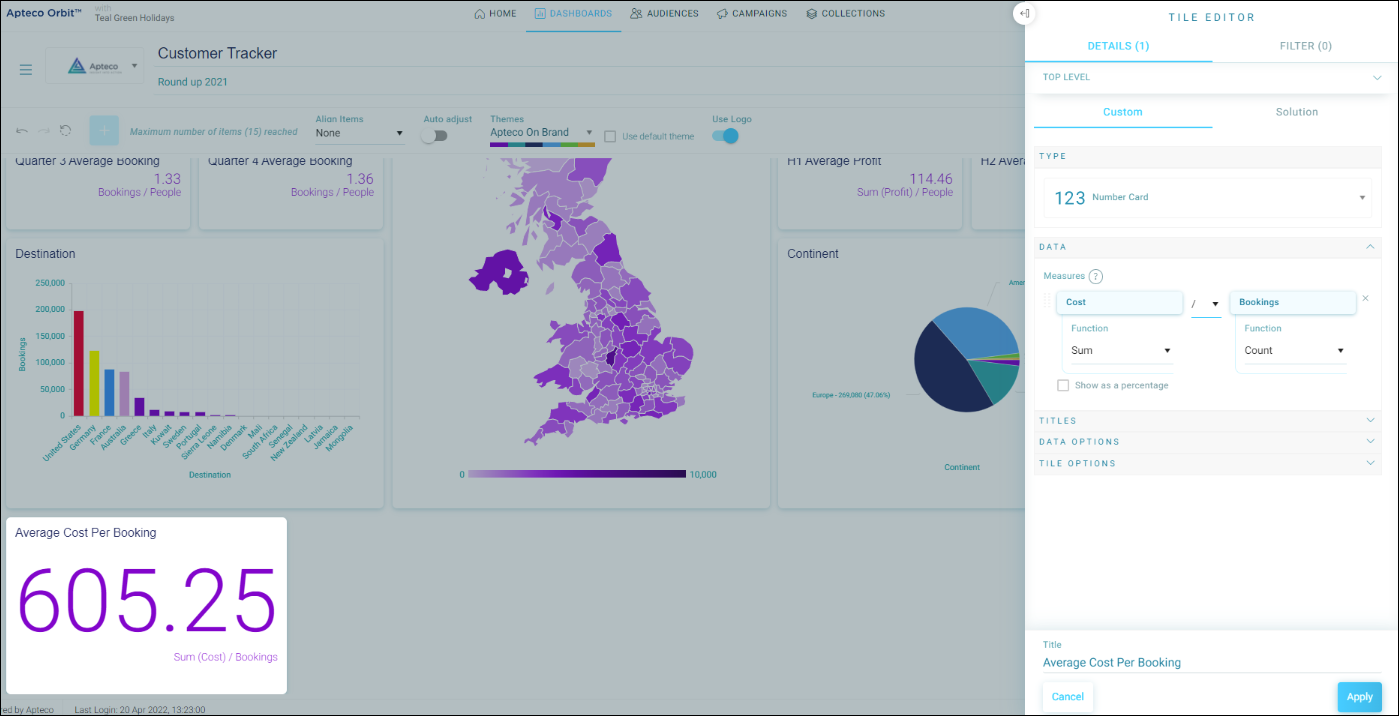
Note
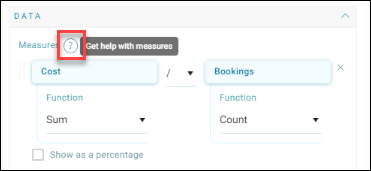
To assist with understanding the impact of using different data variables which describe different data types and therefore may sit in different data tables within your data structure, there is a Help Icon within this feature, which takes you straight to more explanation on this topic.
-
Once the tile has been created, click Save to save the dashboard with the new Measure in place.
Designing dashboards with calculated measures
If you are designing a dashboard and you wish to predefine calculations within a tile using Calculated Measures, then there are three concepts that you need to understand:
- Data is stored in tables
- Tables can be joined together in different ways
- Different joins produce different results
Don’t worry, you don’t need to define, create, or adjust the tables. However, you do need to decide how you are going to join the tables within your calculation, dependent upon the results you are trying to achieve. With Calculated Measures, Apteco software attempts to do this for you.
This document is designed to help you get the result you are expecting. It takes a step back to explain the basic concepts of how data tables are related, and how the three main join types that Calculated Measures uses, impact the results that you get.
Joins
We all want data from many different sources to be in one place, with the ability to use it all to understand our customers, their purchases, and their interactions with us. To enable this insight, whatever the goal, data from different tables needs to be ‘joined’ together in a certain way to get an accurate account of activity. There are three types of joins commonly used for customer analysis.
Note
Different joins provide different results. This document explains what we mean when we talk about tables and goes on to explain three join types and provides examples of their application.
The three join types discussed are:
- Right Join
- Inner Join
- Left Join
How to implement the different joins within a calculated measure tile
Left join: including all relevant records from the left table and only the related records from the right table
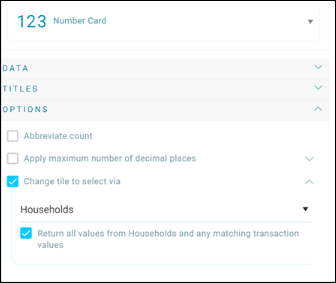
We do this by editing the tile where the calculation is being applied and under OPTION select ‘Change the tile to select via’. Under this option nominate the Left Table that the value being used in the calculation originates from and tick the box to ‘Return all values from the ‘xxxxx’ and any matching transaction values.
Note
The ‘xxxx’ changes to reflect the nominated table.
In the example below the table being selected is the ‘Households’ table.
Note
Avoid allowing the user to apply a filter to anything other than the Left Table or the calculation doesn’t provide the expected result.
Inner join: only include those records from the left table that are related to records in the right table, and at the same time only include records from the right table that are related to records in the left table
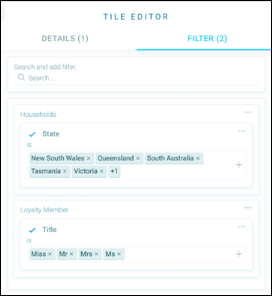
We do this by editing the tile where the calculation is being applied and apply two filters. The first selects all records from the Left table the second selects all record from the right table. These filters are designed to ensure that only the interrelated records from both tables are selected. In the following example the left table is ‘Households’ and the right table is ‘Loyalty Members’. A selector attribute has been chosen from each and all the categorise within those attributes (State, and Title) have been applied as a filter.
Right join: including all relevant records from the right table and only the related records from the left table
This calculation happens without the need for any adjustment by the dashboard designer.
Note
Avoid allowing the user to apply a filter to anything other than the Right Table or the calculation doesn’t provide the expected result.