Behaviours
Behaviours in Orbit give you recency, frequency, and value statistics (RFV) directly from your customer and transaction data. Rather than building complex Audiences before you can analyse your data, you configure a behaviour once and use it across your dashboards and audiences.
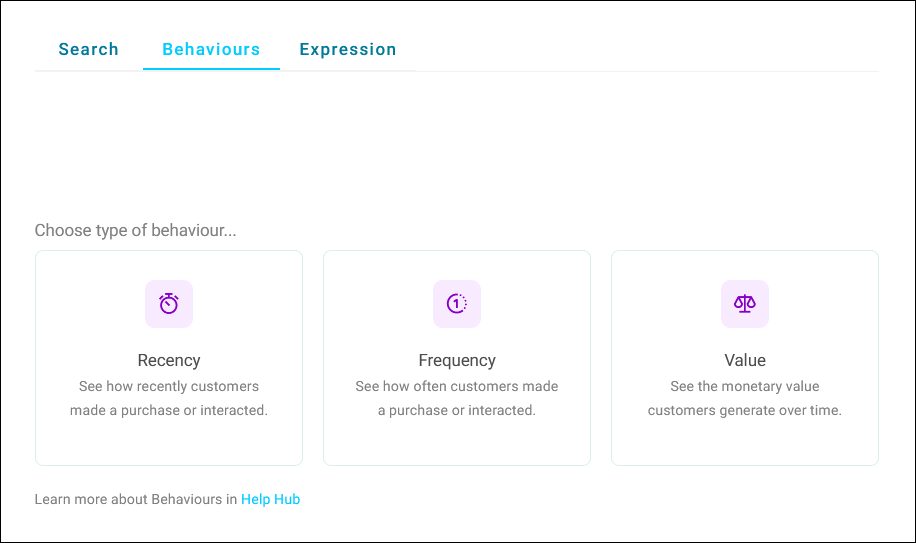
Each behaviour targets a different aspect of how your customers engage with your brand.
| Dimension | What it measures |
|---|---|
| Recency | The most recent (or earliest) value of a transaction variable for each contact |
| Frequency | A count of transactions per contact, optionally filtered to a specific subset |
| Value | An aggregation of a numeric variable across transactions |
The key benefit of behaviours is that they give you factual evidence rather than assumptions. Whether you need to know if customer spend is declining, whether donation frequency matches your expectations, or how long the typical gap is since a customer last transacted, behaviours surface that evidence on the dashboard without requiring any audience building work.
Understanding customer cohorts
A common starting point with behaviours is to map your customer base into cohorts based on their engagement level. A typical segmentation looks like this:
- First-time customers: Contacts making their first-ever transaction, and what that transaction was worth
- Active customers: Contacts transacting within your expected frequency and value range
- Lapsing customers: Active contacts who have started to drop off and their recency, frequency, or value is lower than expected
- Dormant customers: Contacts who haven’t transacted for a significant period and need a re-engagement campaign
What counts as "lapsing" or "dormant" depends on your purchase or donation cycle.
Examples
- A car manufacturer might consider two years between purchases entirely normal
- A grocery retailer would treat a two-week gap as a warning sign
Behaviours give you the data to calibrate your own thresholds against reality.
Example use case
Once you have identified lapsing contacts, you can route them into a nurture campaign with targeted offers. Once re-engaged, they move back into your active cohort.
How Orbit resolves behaviours
When you apply a behaviour, Orbit performs an on-the-fly aggregation. It retrieves all child records (for example, bookings or purchases) linked to each parent record (for example, a person or household), applies any transaction-level filter you have specified, and computes the result at the parent level. That resolved value feeds into charts, filters, and audience counts.
Table hierarchy requirement
Behaviours require a parent-child relationship between tables in your data model. The transaction table must sit below the grouping table in the hierarchy.
Note
If the Behaviours tab does not appear in the variable picker, the table you are working with may not have a child transaction table configured.
See Orbit connect or contact your system administrator.
Where you can use behaviours
You can add behaviours in several locations across Orbit. The options available to you depend on the tile or context you are working in.
Dimensions
Use behaviours as dimensions on charts, cubes, Venn sets, and data grid columns. As a dimension, a behaviour groups your data by the resolved RFV value.
Example
Adding a recency behaviour as a dimension on a bar chart lets you group contacts by their most recent product purchase, showing how many people fall into each product category.
Tip
The dimension does not have to group by people. You can swap the grouping to any available variable, giving you flexibility to cut the data in different ways on the same chart.
Measures
Use behaviours as measures on charts, cubes, venn sets, and number tiles.
Examples
On a number card you could add:
- A recency measure showing the spend associated with each contact's first-ever booking this year
- A frequency measure showing the count of accommodation-only bookings per person
- A value measure showing the average profit per person for bookings to a specific destination
Calculated measures
Reference behaviours inside calculated measures to build proportional or comparative figures.
Examples
- Frequency of bookings in year one divided by frequency of bookings overall, to understand early engagement as a proportion of lifetime engagement
- Average spend this year compared to average spend last year, to track whether value is growing or declining
Venn diagrams
Use behaviours to define the sets in venn diagrams.
Note
You cannot add a behaviour as a measure to a Venn tile. Behaviours are supported as set definitions only.
Dashboard filters and analysis filters
Add behaviours as user filters and dashboard filters to drive the data shown across an entire dashboard. This is useful for building an RFV summary view.
Example
A filter on recency (most recent booking date), a filter on frequency (number of bookings in the past 12 months), and a filter on value (total spend) give you a set of controls that let you explore your customer base interactively.
Analysis filters work the same way and are available when building profile tiles.
Audience filters
Add behaviours as filters when creating an audience.
Example
Include all contacts whose most recent booking destination was Australia, by configuring a recency behaviour on destination ordered by booking date, then setting the condition to a specific value.
When you add a behaviour to an audience filter, Orbit displays an RFV icon next to the clause, indicating whether it is a recency, frequency, or value behaviour.
Note
Behaviours are not available in measure filters or compare filters within audiences.
Recency behaviours
Use recency to retrieve the most recent (or earliest) value of a variable for each contact.
Adding a recency behaviour
To add a recency behaviour:
- Go to where you want to add a behaviour and click + Add Filter.
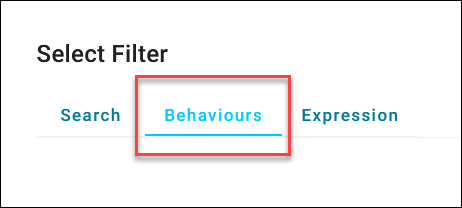
- In the Select Filter dialogue, click Behaviours.
- Select Recency.
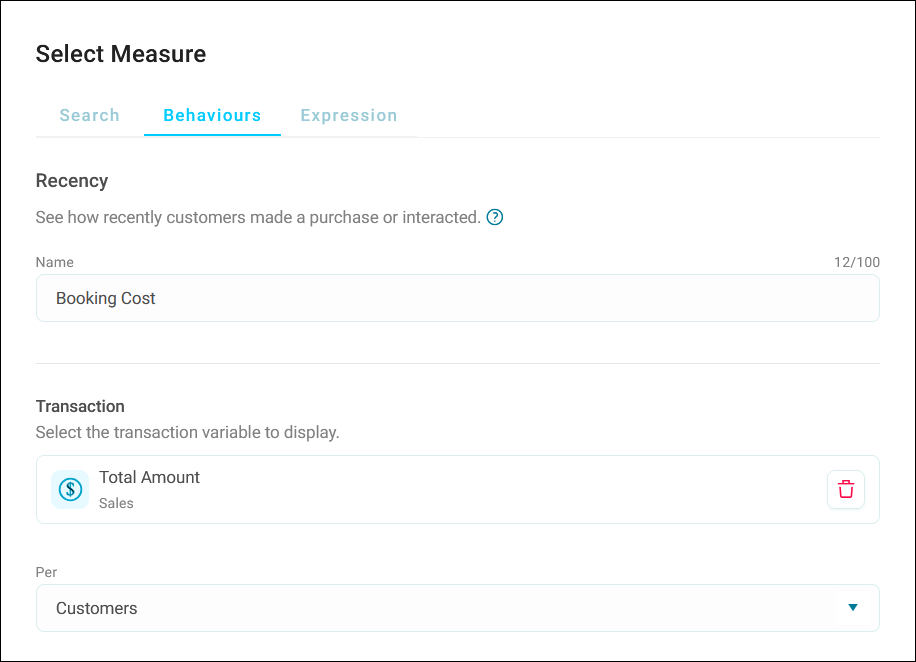
- Enter a Name for the behaviour.
- Under Transaction, click + Add Variable and select the variable whose value you want to retrieve.
-
Under Per, select the relevant table.
-
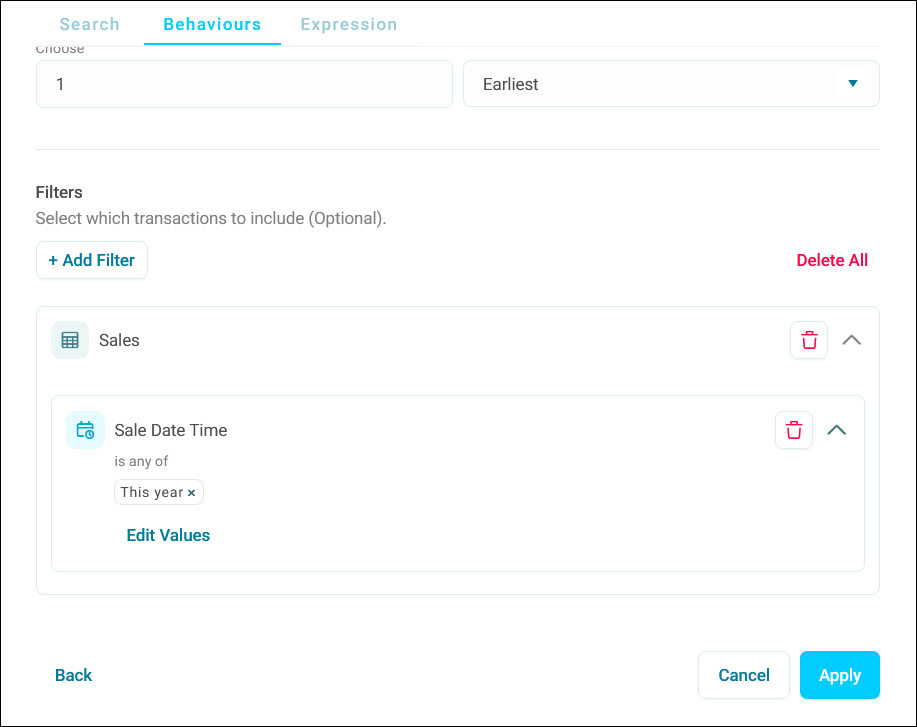
Under Order by, click + Add Variable and select a date or numeric variable to order by.
- You can now choose how many of the Earliest or Latest records.
-
Optionally, click + Add filter to restrict which records are included in the calculation.
Tip
Use a date range filter within the behaviour to scope recency to a specific window, for example, bookings from two years ago to one year ago. This lets you compare cohorts across time periods without building separate audiences.
-
Click Apply.
Note
The transaction variable and the variable used to order records must both belong to the same transaction table. If you select a variable from a different table, Orbit will not offer a compatible variable.
Frequency behaviours
Use frequency to count how many transactions each contact has, optionally scoped to a specific subset.
Frequency is not limited to purchases. You can count any repeatable transaction-level event: bookings, complaints raised to a call centre, abandoned baskets, and so on.
Adding a frequency behaviour
To add a frequency behaviour:
- Go to where you want to add a behaviour and click + Add Filter.
- In the Select Filter dialogue, click Behaviours.
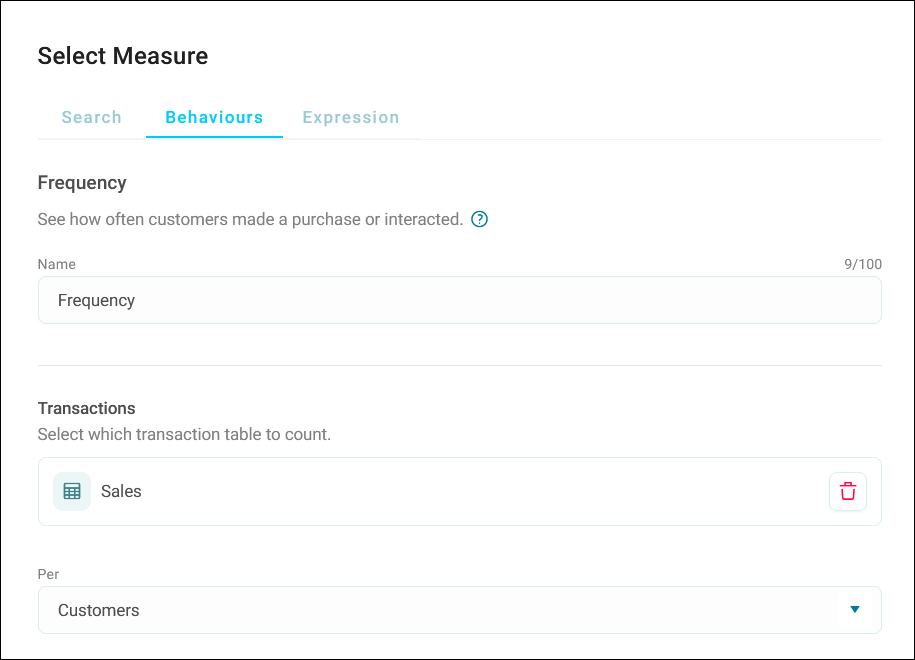
- Select Frequency.
- Enter a Name for the behaviour.
- Under Transactions, click + Add Table and select the child transaction table.
-
Under Per, select the relevant table.
-
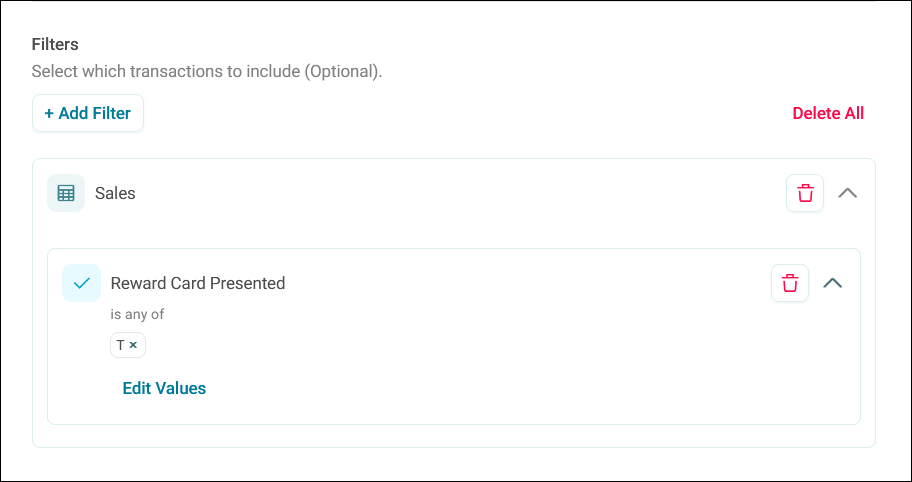
Optionally, click + Add filter to restrict which records are included in the calculation.
Tip
A transaction filter is particularly valuable with frequency. Counting all transactions ever is rarely actionable. Filtering to a specific product type, date range, or destination gives you a count that maps to a real business question, for example, the number of accommodation-only bookings per person.
-
Click Apply.
Value behaviours
Use value to aggregate a numeric or currency variable across transactions.
Examples
- Total spend
- Average profit
- Maximum transaction size per contact
Adding a value behaviour
To add a value behaviour:
- Go to where you want to add a behaviour and click + Add Filter.
- In the Select Filter dialogue, click Behaviours.
- Select Value.
- Enter a Name for the behaviour.
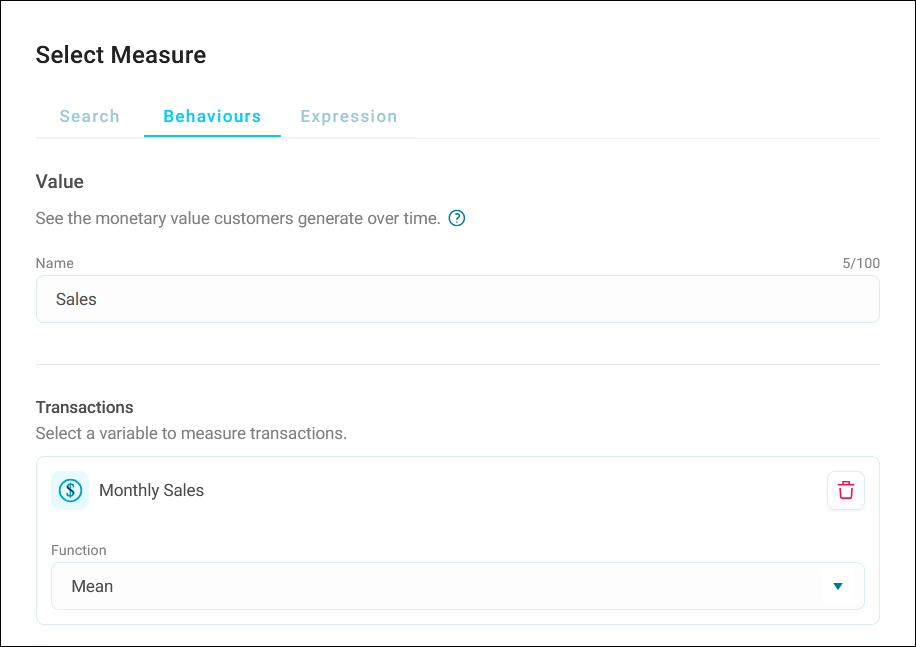
- Under Transactions, , click + Add Variable and select a numeric or currency variable.
-
Under Function, select an aggregation function (see Aggregation functions on value behaviours below).
-
Under Per, select the relevant table.
- Optionally, click + Add filter to restrict which records are included in the calculation.
- Click Apply.
Tip
Combining frequency and value behaviours on the same dashboard lets you identify meaningful sub-segments within your active customer base: for example, contacts who transact infrequently but at high value versus those who transact often but only for low-value items. These two groups warrant different offers and messaging even if their total spend is similar
Aggregation functions on value behaviours
The following functions are available when configuring a value behaviour.
| Function | Description |
|---|---|
| Sum | Total of all transaction values |
| Mean | Arithmetic average across transactions |
| Maximum | Highest single transaction value |
| Minimum | Lowest single transaction value |
| Median | Middle value when all transactions are sorted |
| Variance | How spread out transaction values are from the mean |
| Standard deviation | Square root of the variance. Expressed in the same units as the original values |
| Rank coefficient | Correlation between the rank order of two variables across transactions |
| Mode | Most frequently occurring value |
| Count distinct | Count of unique values across transactions |
Transaction filters
Any behaviour accepts an optional transaction filter. This restricts which child records are included in the aggregation before the result is computed at the parent level.
Note
A transaction filter operates only within the behaviour it is attached to. It does not affect other clauses in your audience definition or other behaviours on the same dashboard.