Venn diagrams
A Venn diagram gives a colourful, graphical representation of how data interrelates. It is advantageous in segmenting the data, for example, when creating target groups for mailings. You can use the Venn to select and analyse your chosen dataset, and then filter a dashboard.
Click on a subset count to zoom in and see a tooltip with details.
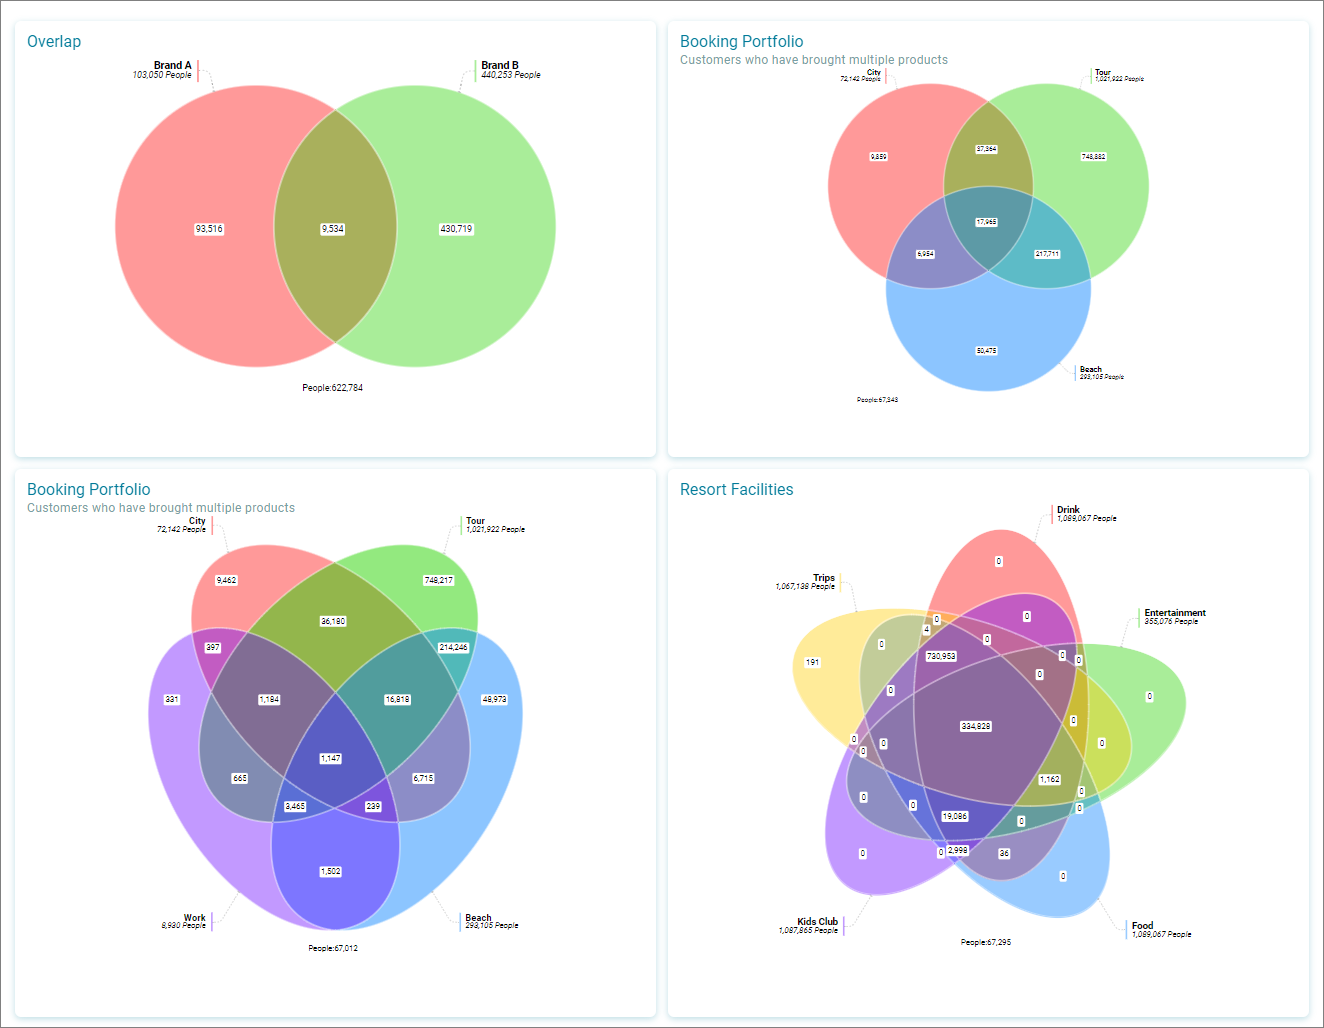
Up to five sets can be used in a Venn diagram. A coloured ellipse representing each set is shown in a different colour. Five default colours are used, however, you can change the colour for each set.
You can add up to five sets.
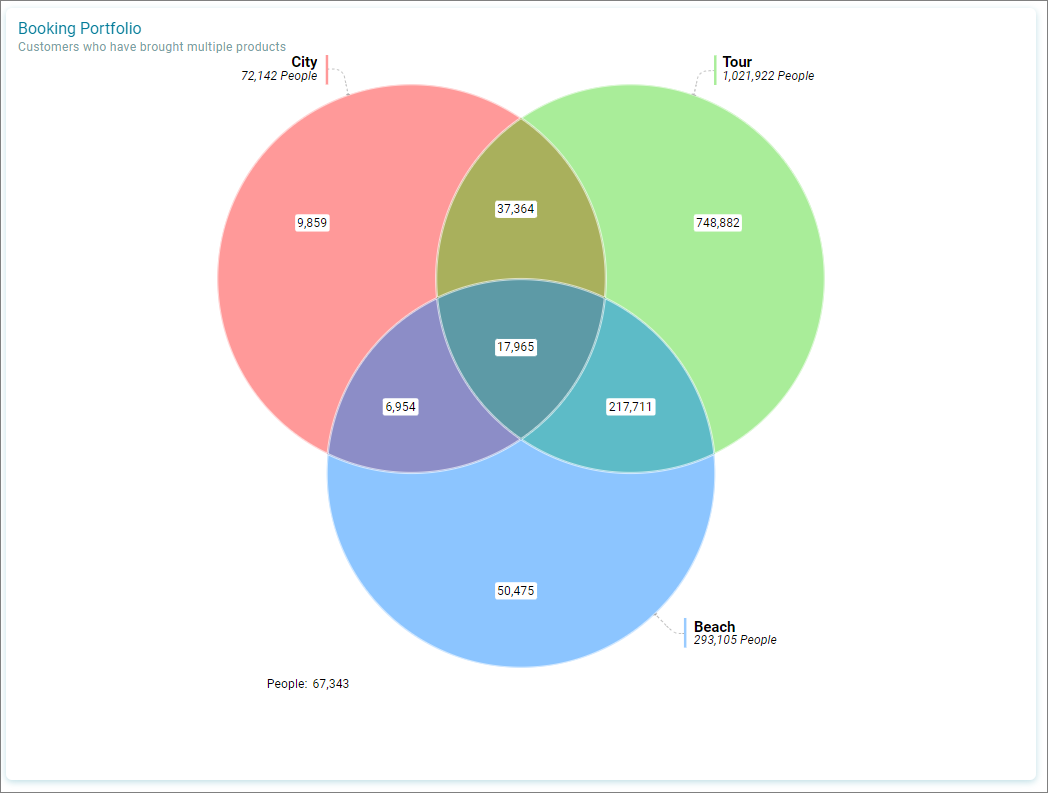
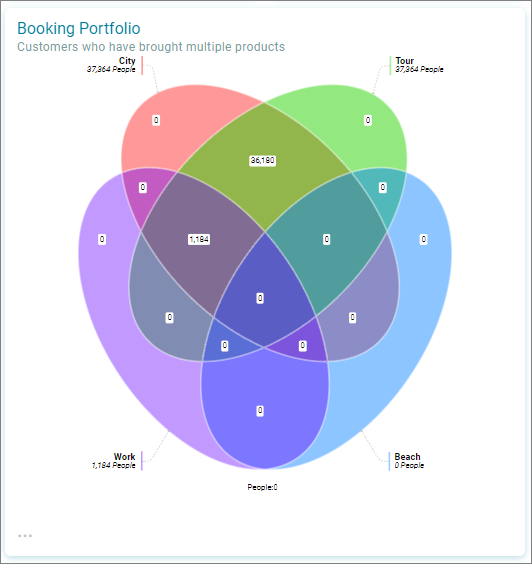
Parts of a venn
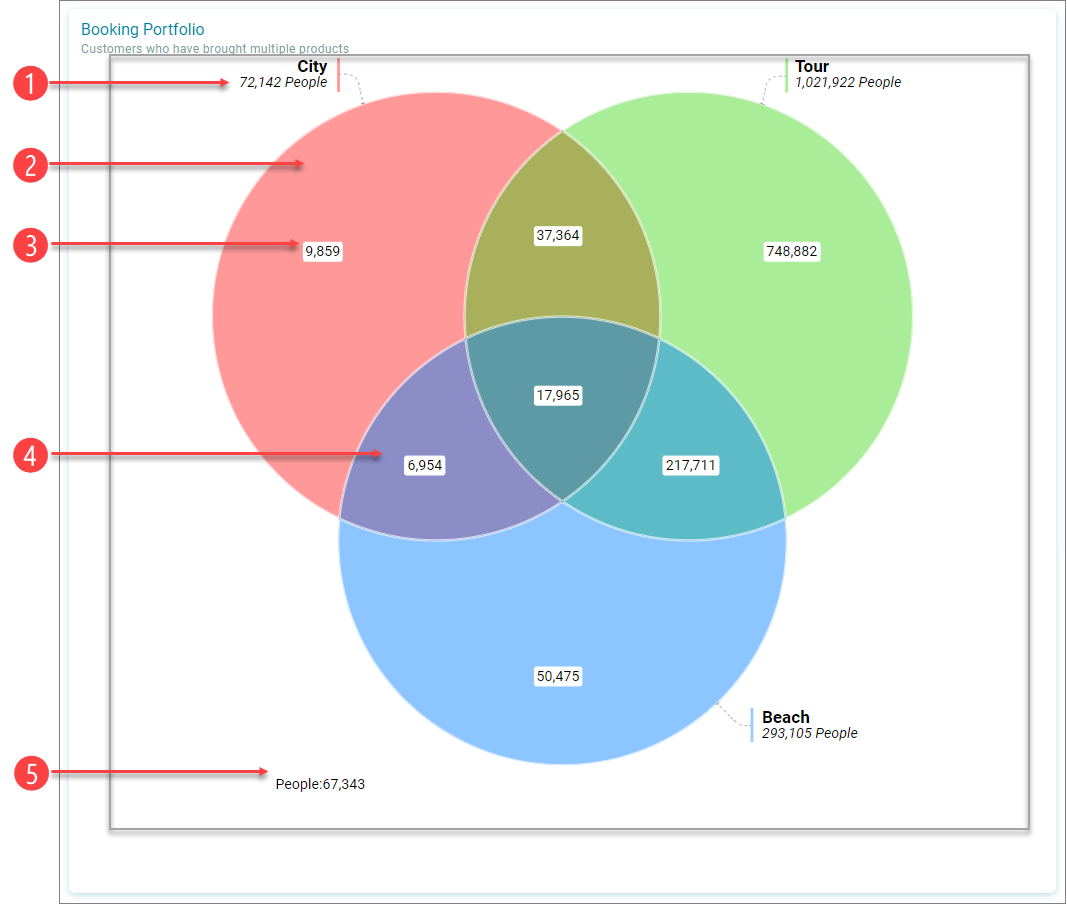
- Total count for a set
- Subset of the "City" set
- Subset count (Click to zoom in to a tool-tip)
- Subset in an Intersect
- Rows from the dashboard table that are NOT in ANY of the sets, (will also be affected by any filters in effect)
Note
Part 5 is also a selectable part of the Venn
Creating a venn diagram
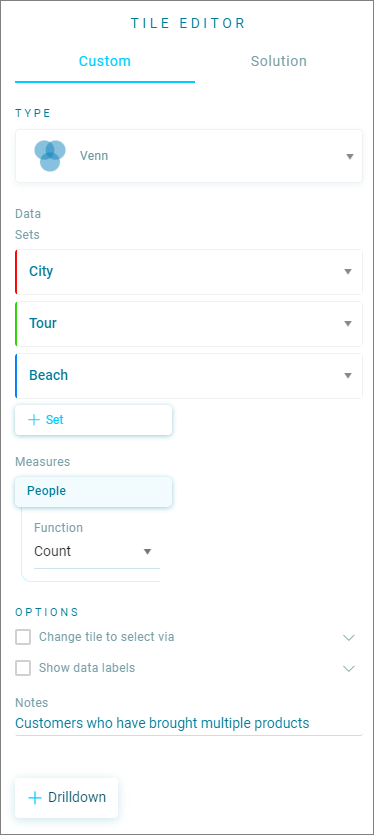
From the Custom Tile tab, select the Venn icon to reveal the data input options for the Venn tile.
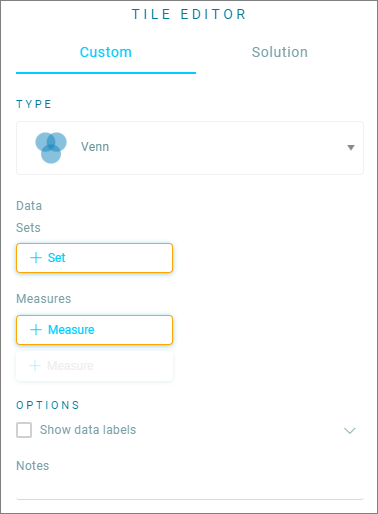
In this example, we are going to determine which "Types" of holidays customers have booked using our example Holidays system.
- Set Name: Enter a name in the Set Name box (City in this example). Max 15 characters.
- Set Data: Click in the Search Data box to open the Search Data dialogue, you can either browse or search for the data.
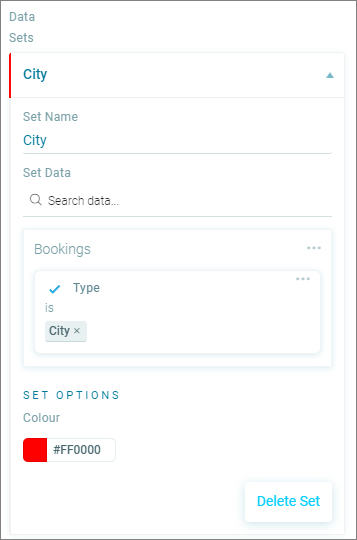
Add at least one more set category up to a maximum of five, in this example we have set up three, City, Tour, and Beach.
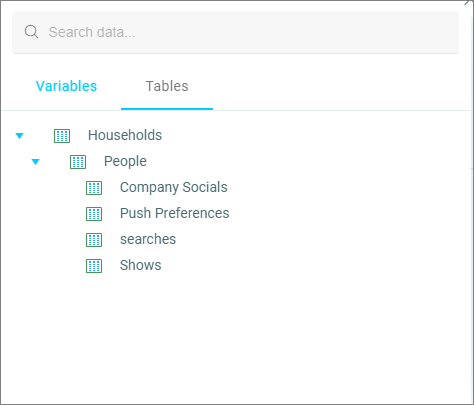
Click in the Measures box to search or browse for the measure, in this example we use the Tables tab and selected People and Count.
As with other tiles you can specify additional options:
- Select Change tile to select via option to Resolve the data to another table (You will only be able to select the current table or from a table higher in the data model hierarchy).
- Select Show data labels to use Abbreviate count.
Tip
Add Notes to explain the set contents or describe what the Venn diagram is showing.
You can also add a Drilldown.
Using the venn diagram
Venn subset count zoom tooltip
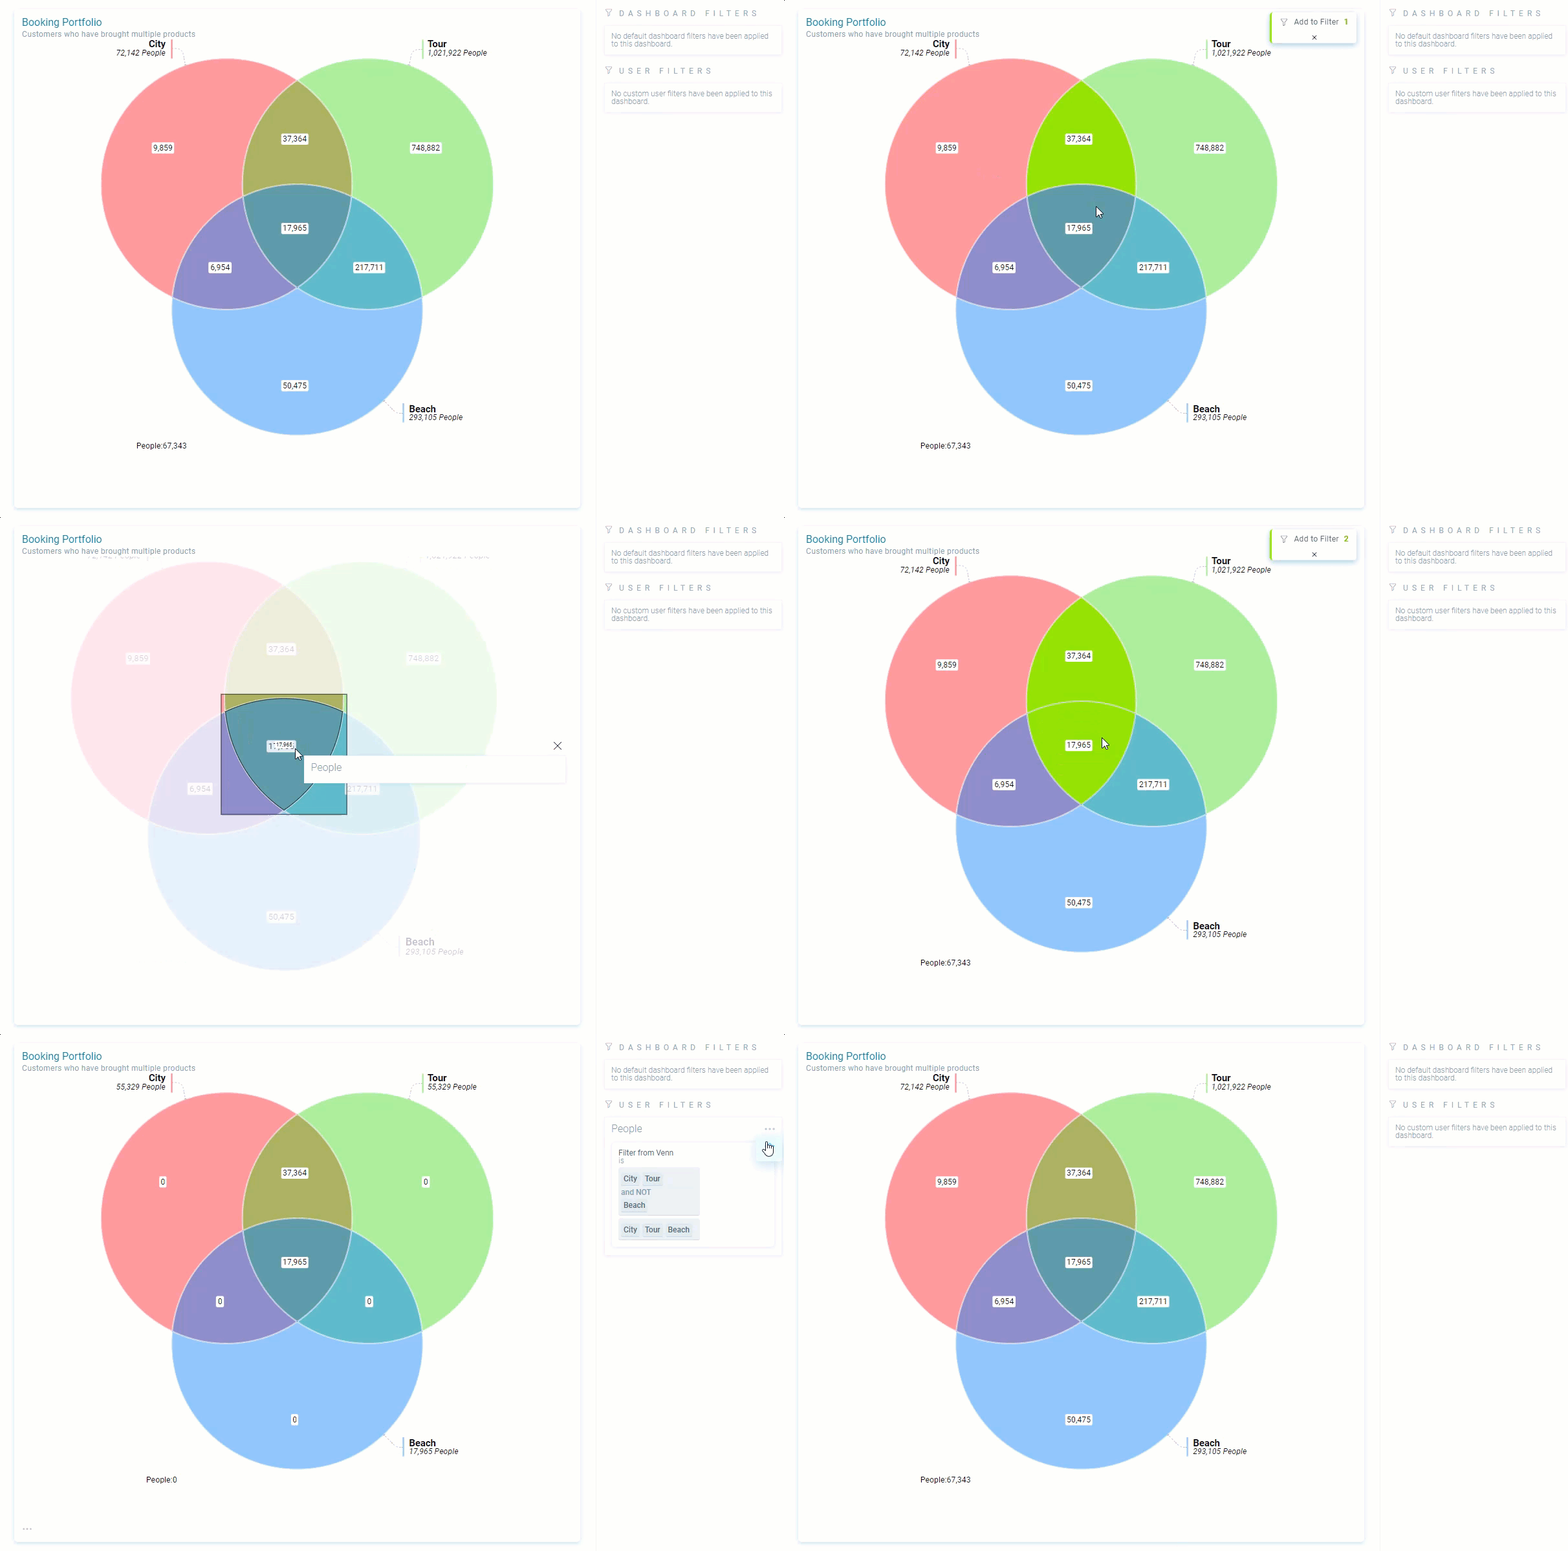
Click on a count inside one of the subsets to zoom in and see details for that count.
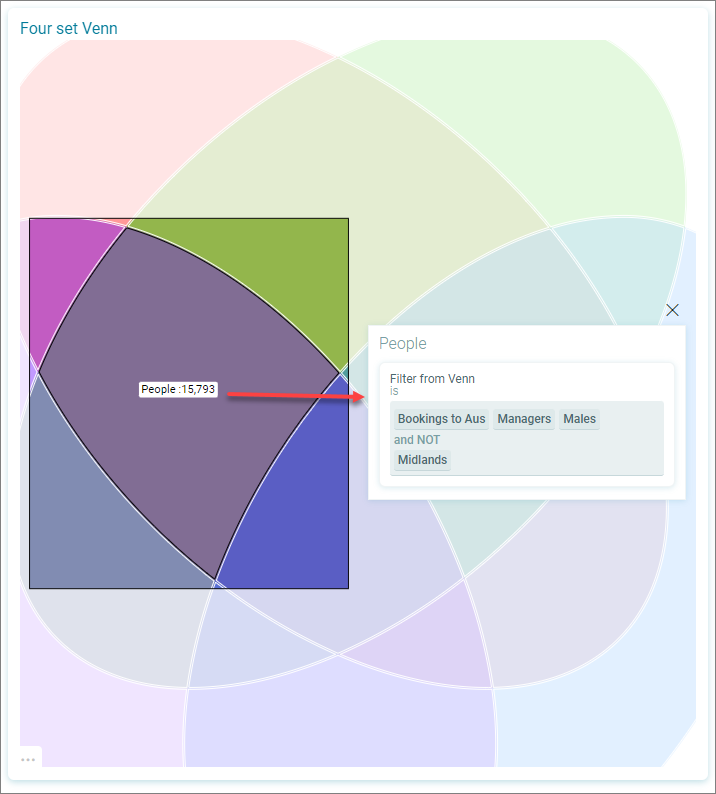
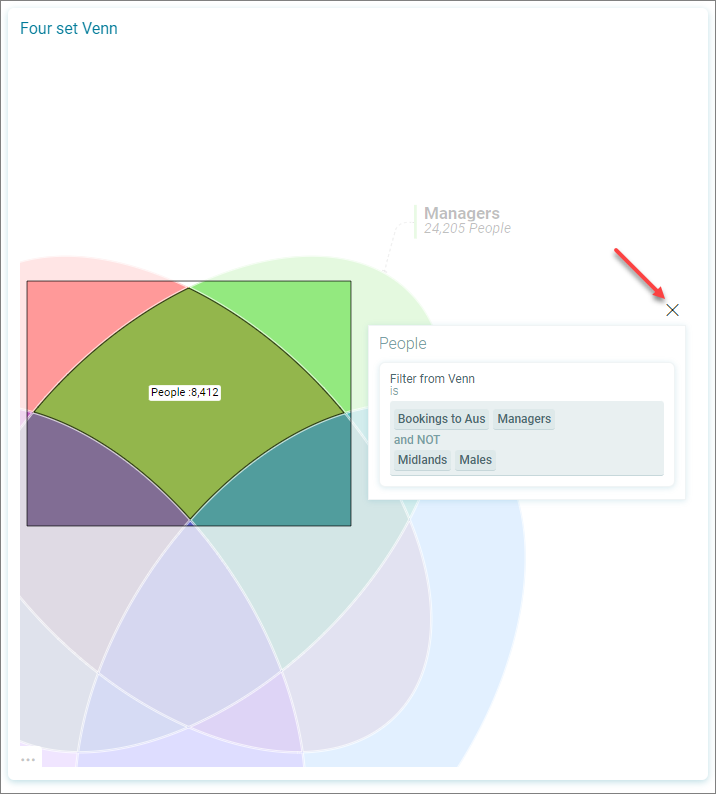
Click the close link to zoom out.
Click to select or deselect subsets then click Add to filter.
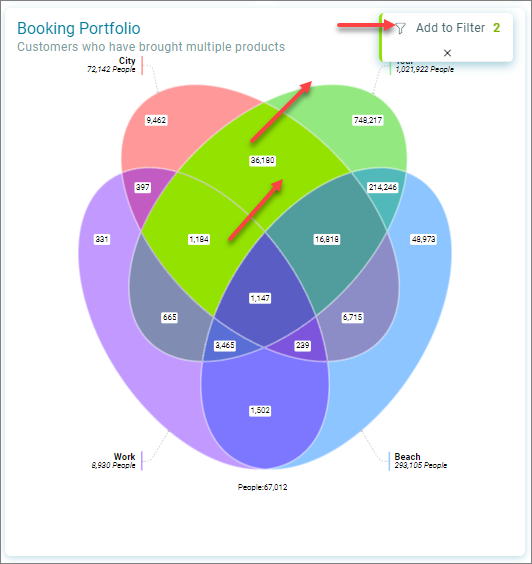
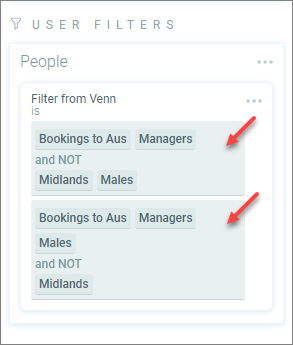
The Filter from Venn filter block displays in User Filters.
Note
You cannot edit the content of a Venn filter, it remains read-only. To change the subsets in a Venn filter you must delete the filter and make another selection.
The Venn diagram in the dashboard shows counts only from the sets included in the filter.
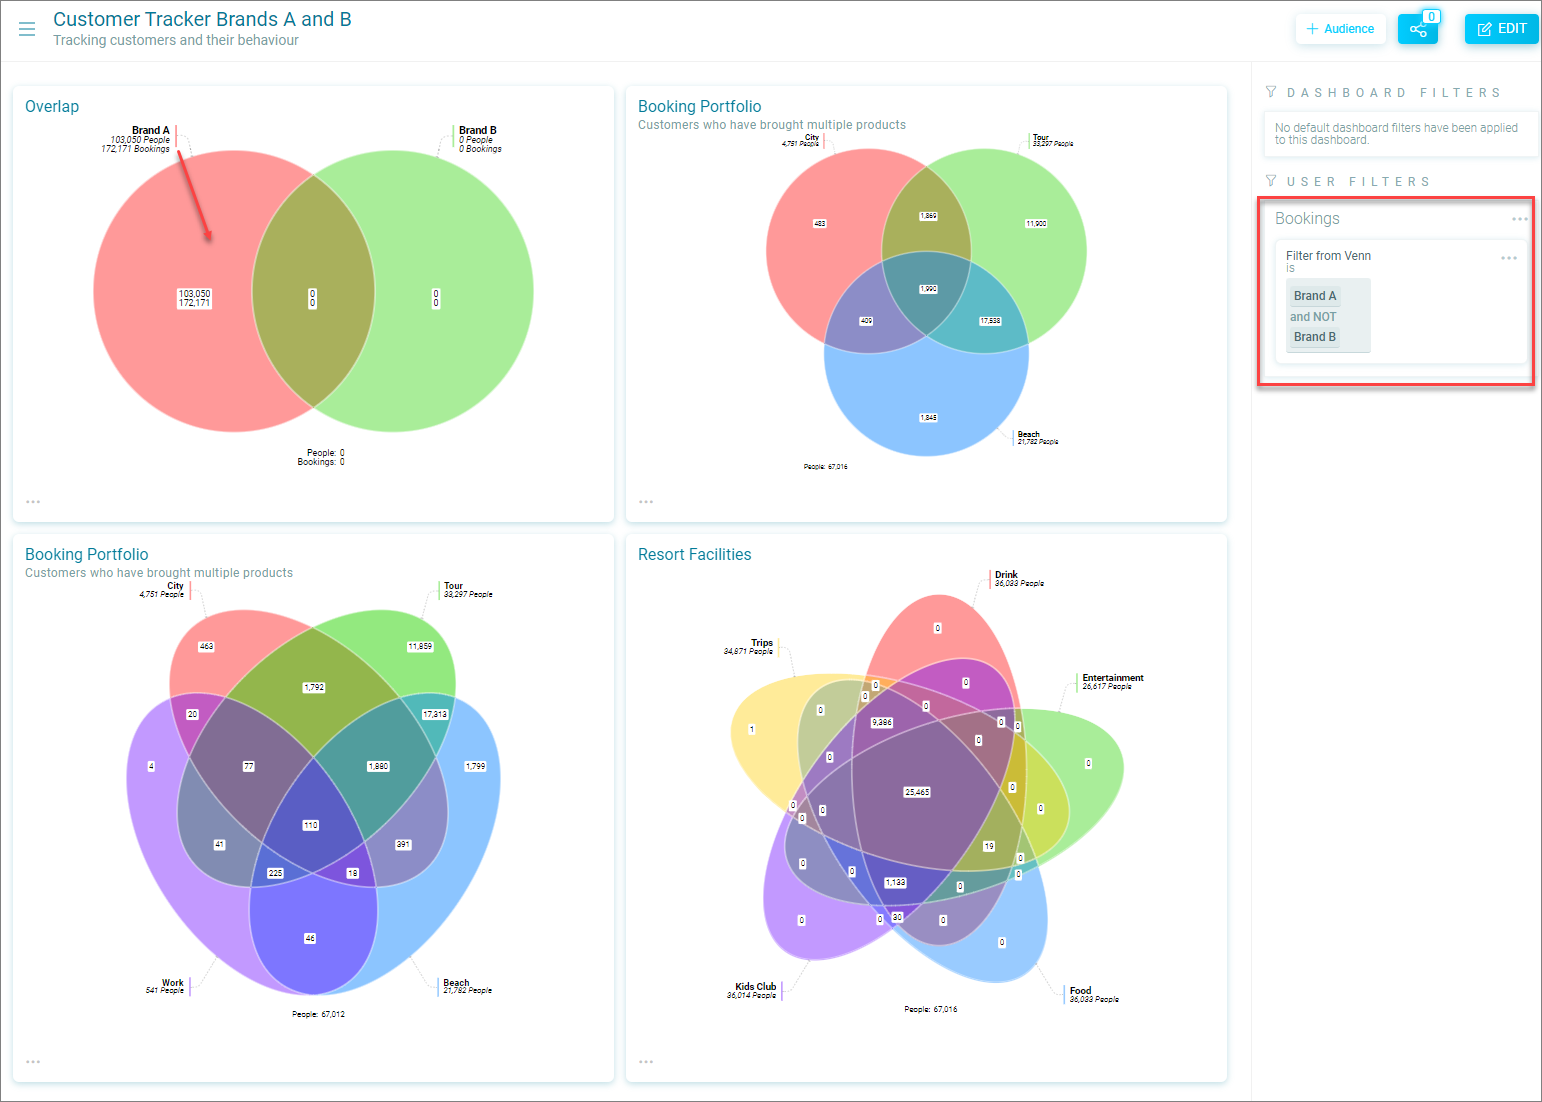
Multi-measure venn
You can define up to five sets and up to two measures on a Venn diagram.
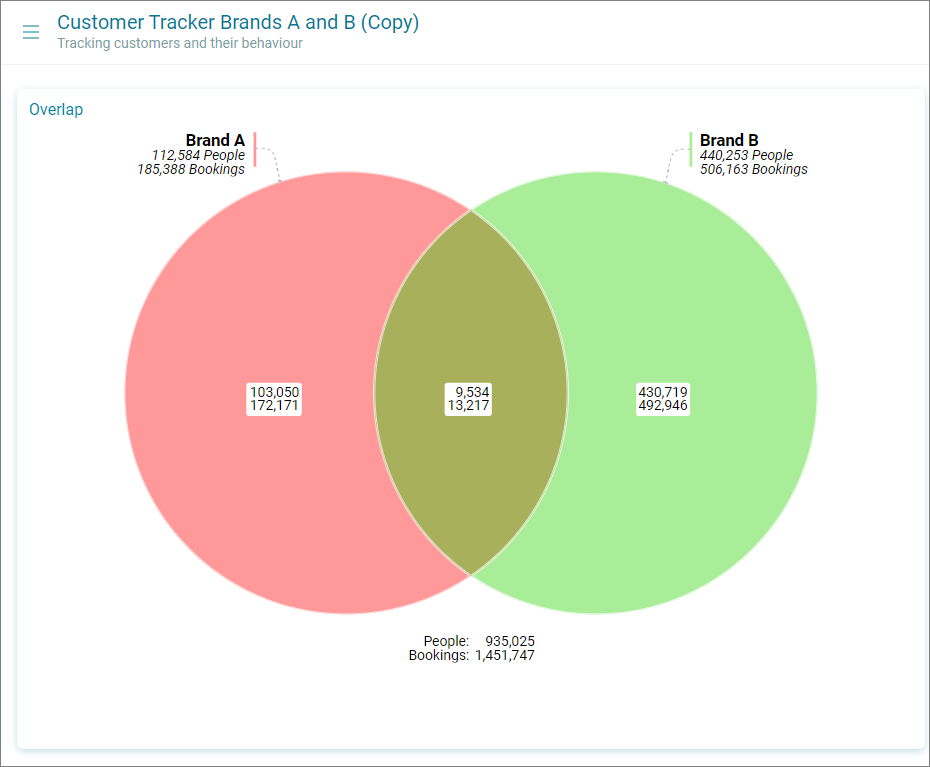
In this example we are counting on two measures People and Bookings.
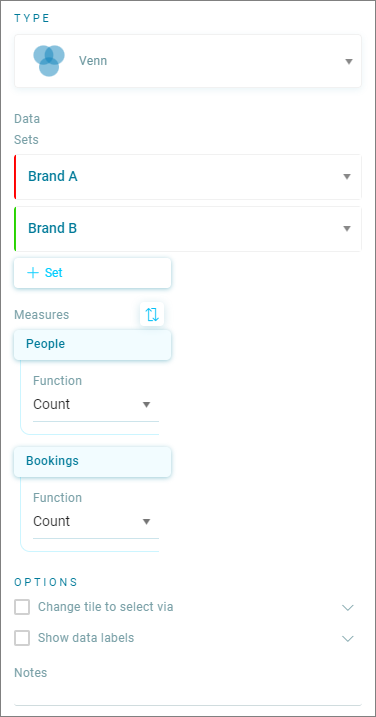
The two sets for Brand A and Brand B are using existing Audiences for the data selection in the tiles.
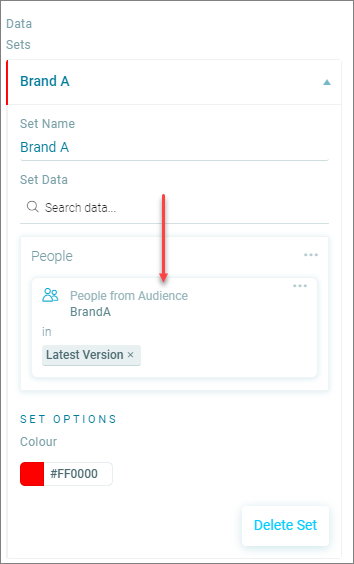
The Venn with two measures can be used to filter the dashboard to analyse by brand, you can see both bookings and people or you can use the tile to see brand data by filtering on one of the other tiles.