Category display
Orbit lets you limit a dimension on a visualisation to the TOP or BOTTOM of the sequence of records when they are ordered by a category data variable.
For example, you may want to fix a limit on one or more tiles to provide focus on a particular aspect of the data.
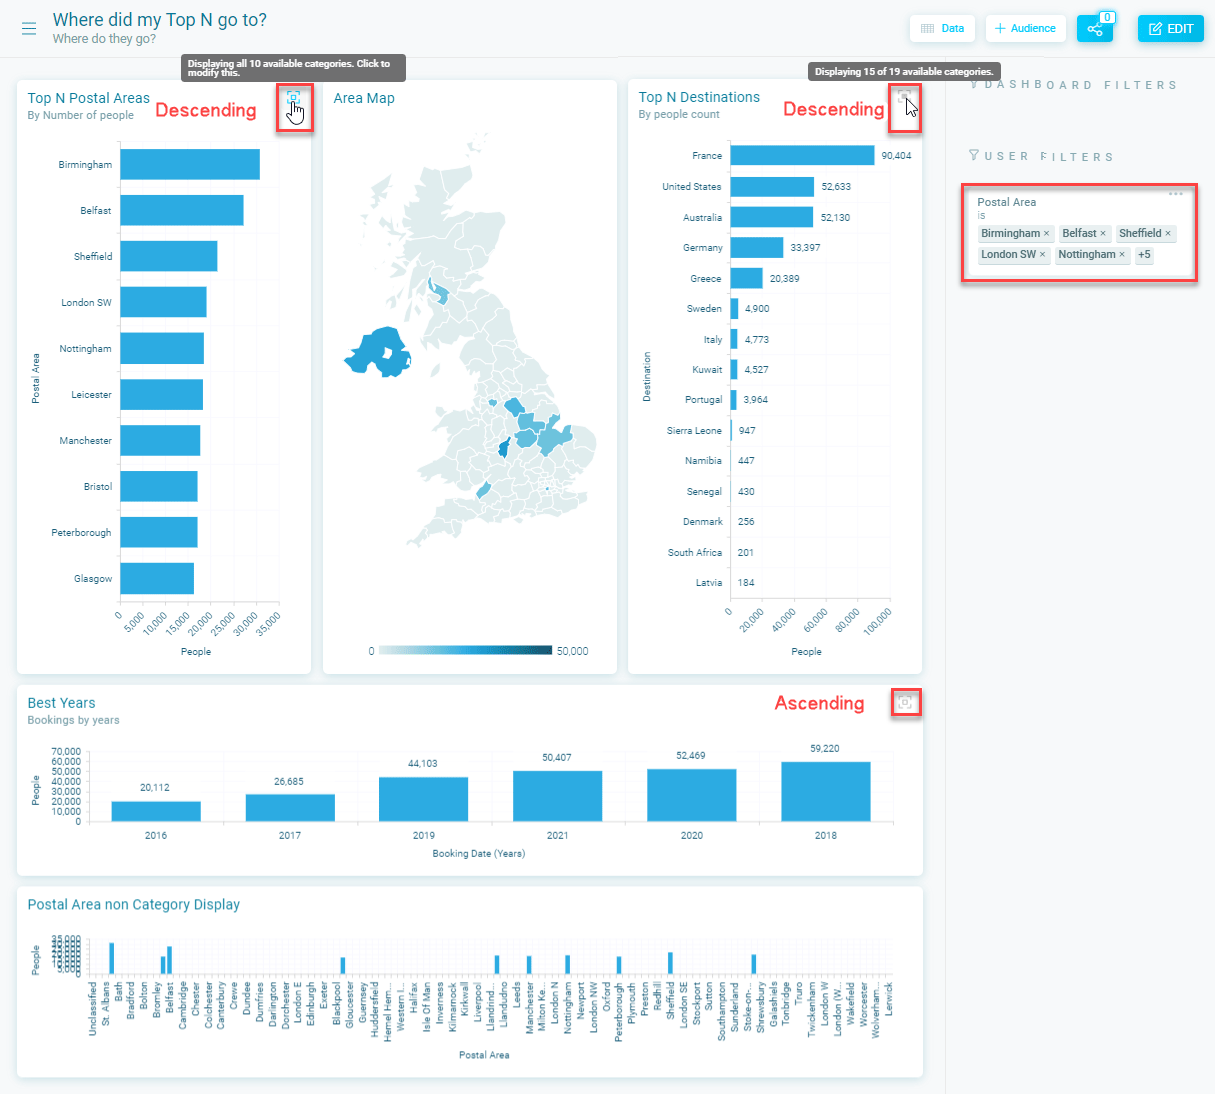
Or you can allow the dashboard user to change the settings
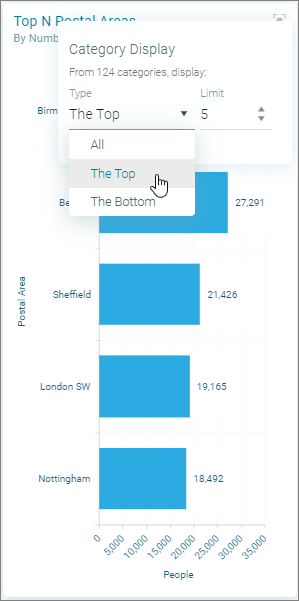
A dashboard editor can enable category filters on dashboard tiles of the following types:
- Bar
- Column
- Pie
- Donut
- Line
- Area Chart
- Category Pareto
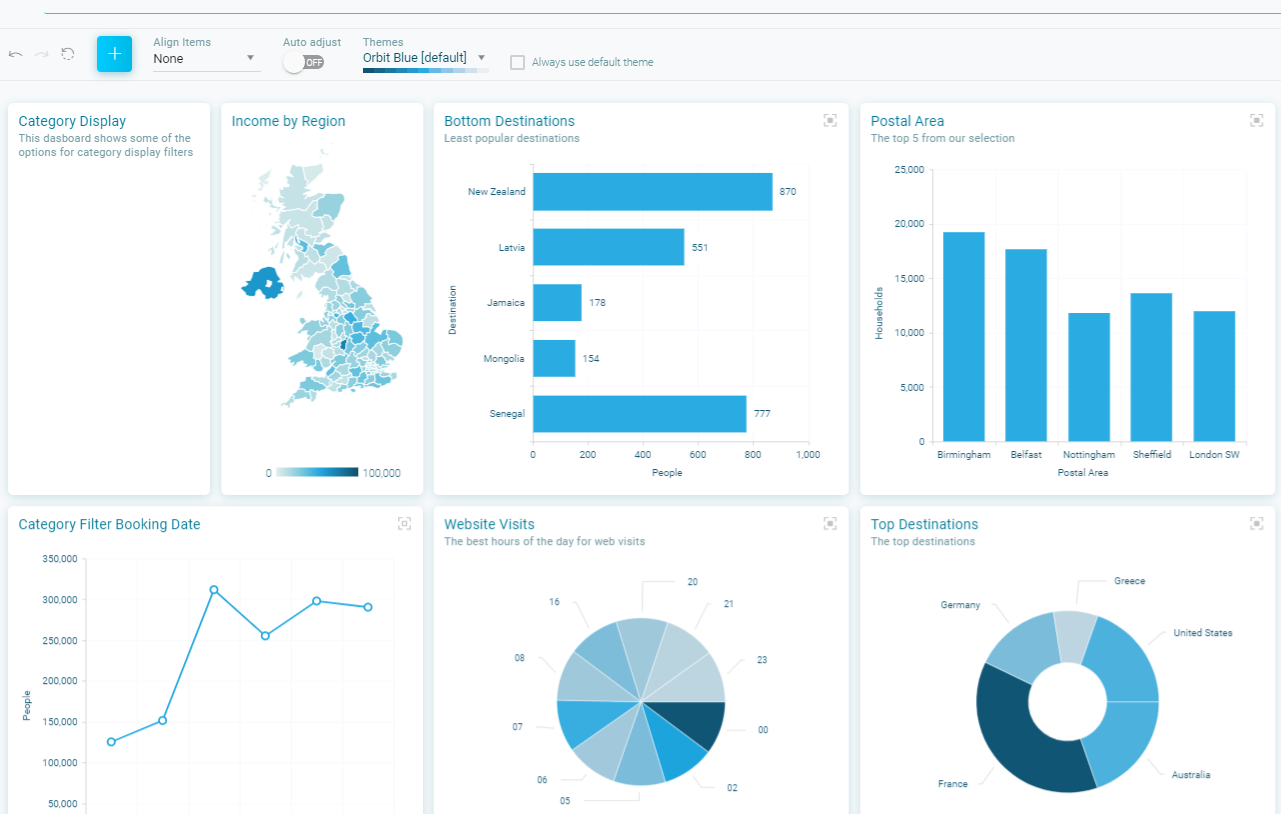
Setting a category display
A category display limit sequences the dimension by the selected measure, for example Postal Area for the Dimension then sequenced by the number of People as the Measure.
- Click + to add a visualisation to a dashboard
-
Select a visualisation, either:
- Bar
- Column
- Pie
- Donut
- Line
- Area Chart
- Category Pareto
Select a Dimension
The Allow category display option is shown
Tip
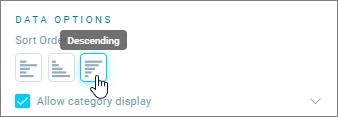
Select Descending or Ascending
-
Select the Allow category display check-box and expand the category display editor
-
Use the display editor to set the Type and Limit:
- Type - All, The Top, The Bottom (the default value is All)
- Limit - Amount (the default value is 2)
Note
If the limit amount is set to the same as the available data bands, the option to allow the user to change the display is disabled in the dashboard view
-
Select the Allow user to adjust the display check-box if you want to allow this
Note
Omit zeros is selected by default when you select the "Allow category display" check-box, we recommend leaving this on as you can get unusual results when you filter data and the remaining options are no longer available
Changing the display as a user
- Click on the Category Display Icon
You can change the Type and Limit, however there are circumstances where you cannot change the setting, see the category display icon topic below.
Category display icons
When you mouse-over the icon you can see a tooltip displaying the current setting, the icon has three states:


Category Display icon options
 Solid blue dot - You can change the limit
 Solid grey dot - Limit cannot be changed
 Hollow blue dot - Limit value is equal to max number available