Profile tiles
Profile tiles in Orbit dashboards help you understand and visualise what distinguishes your target audience from your broader customer base.
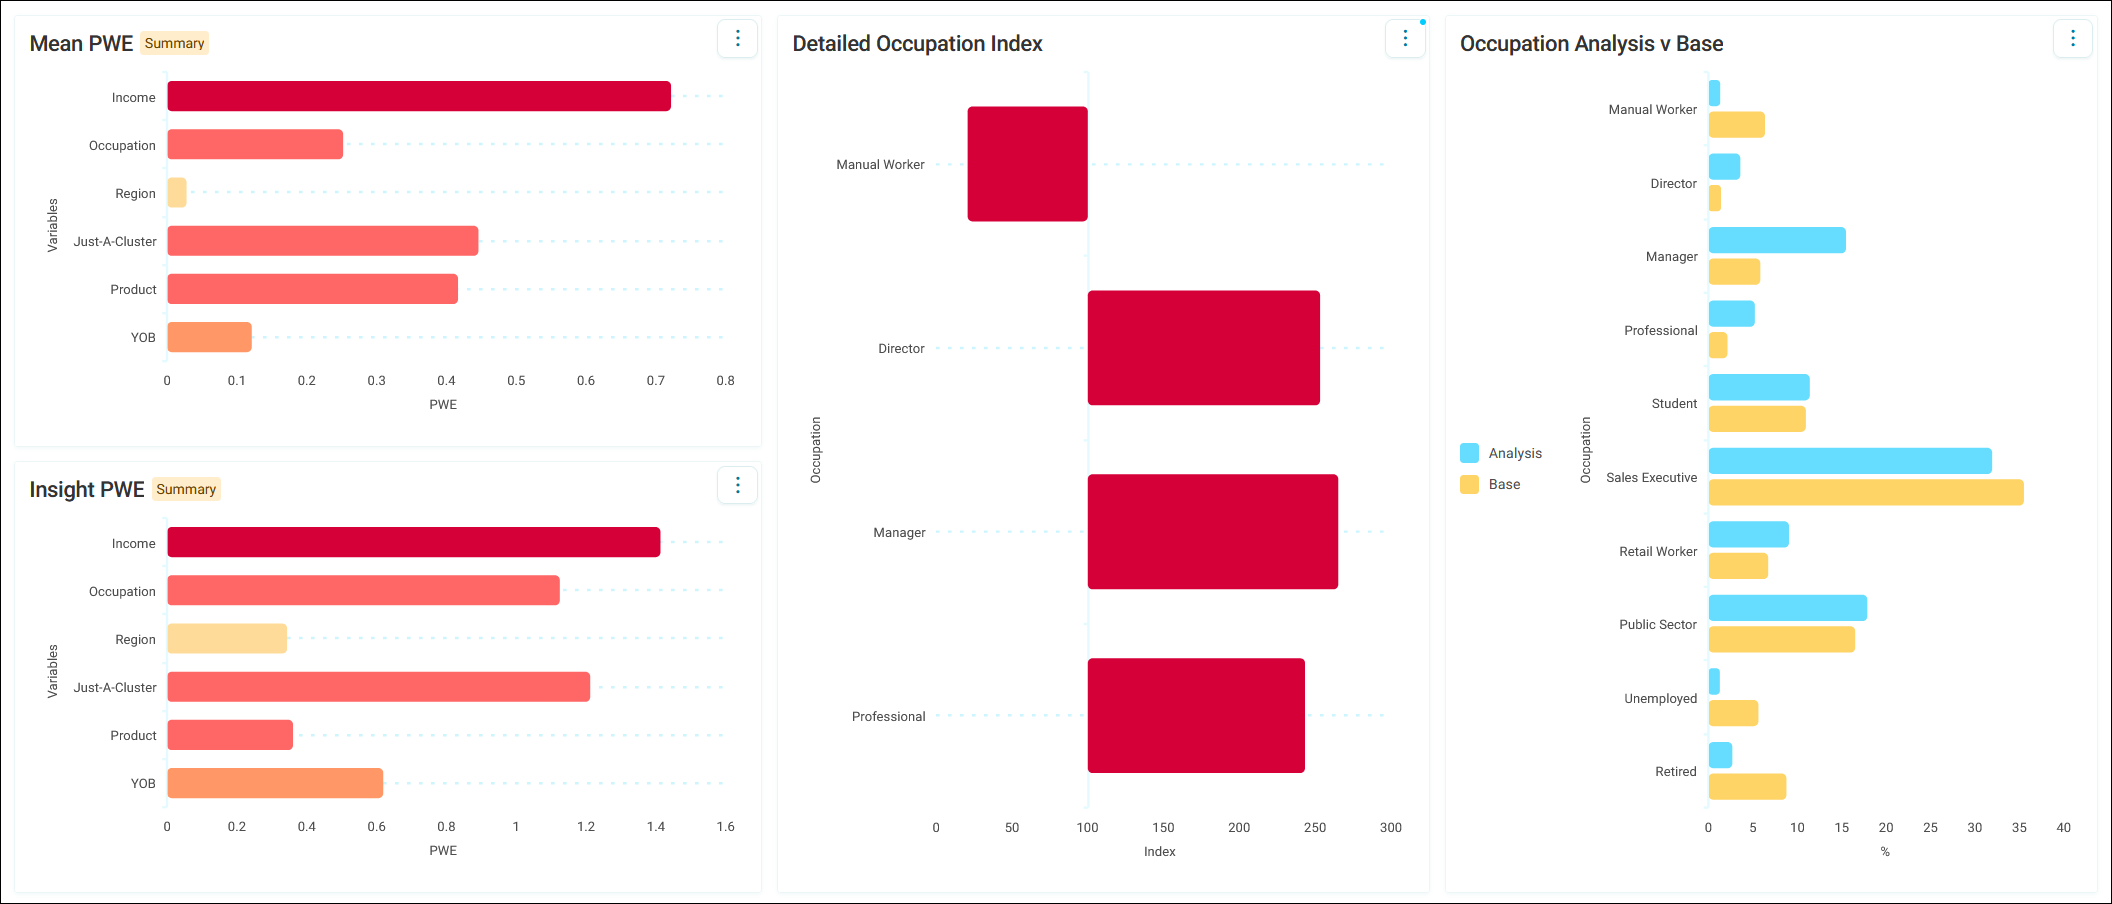
Profile tiles compare a specific analysis group against your customer universe or a filtered dataset. Using statistical calculations, profile tiles highlight which characteristics are significantly over or under-represented in your target audience.
You can choose from:
- Summary profiles: Showing aggregated insights across variables
- Detailed profiles: Breaking down specific variables into categories
You can then add categories from a profile tile to your User filters.
Example use cases
Identifying look-alike customers
Profile customers who spent over £5,000 in the last year to discover they're typically aged 45-65, live in specific regions, and engage via email.
Use these insights to create look-alike audiences and focus acquisition on high-potential segments.
Understanding market potential
Discover that charity customers represent 30% of your database but only 2,500 prospects remain, while retail organisations are under-represented with 45,000 untapped prospects.
This helps you prioritise underserved sectors and identify conversion characteristics.
Prerequisites
Before creating profile tiles, you need:
- Edit permissions on dashboards
- At least one analysis filter configured on your dashboard
- Selector variables in your system
- Sufficient data in both your analysis group and base population for meaningful comparison
Tip
Profile tiles work best when you have clear, well-defined selector variables in your system.
Note
Drilldowns are not available for Profile tiles.