Visualisation settings
With certain visualisation types you can optionally:
Select and complete the required Dimensions and Measures and use the buttons and sort options to set the behaviour and information to display
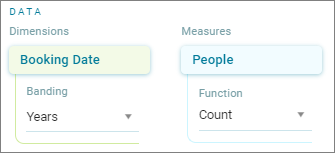
Dimensions are used to partition the data in a visualisation. Dimensions are qualitative, for example, sales region, location, and dates.
Measures are numerical values that a mathematical function works on. Measures represent numerical data that functions work on, for example:
- Count
- Sum
- Mean
- Minimum
- Maximum
- Median
- Variance
- Standard Deviation
- Lower Quartile
- Upper Quartile
- Inter Quartile Range
- Percentile
- Count Distinct
Function options available
For definitions of each aggregation function, see Aggregation functions in a cube.