Single dimension charts
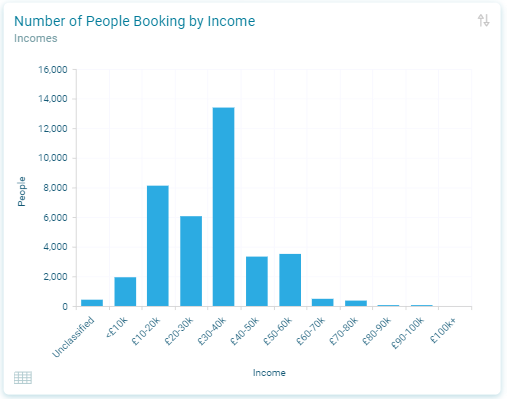
Column chart
Display categorical data horizontally with the length of each column representing the category's value.
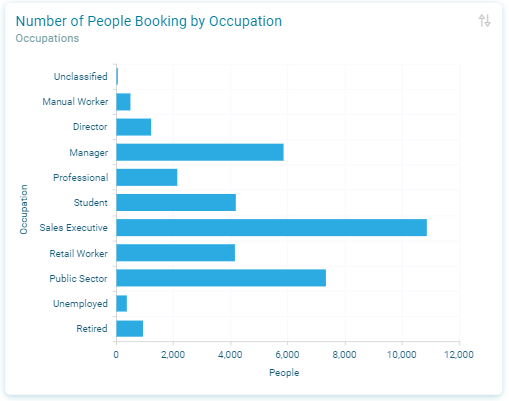
Bar chart
Display categorical data vertically with the length of each bar representing the category's value.
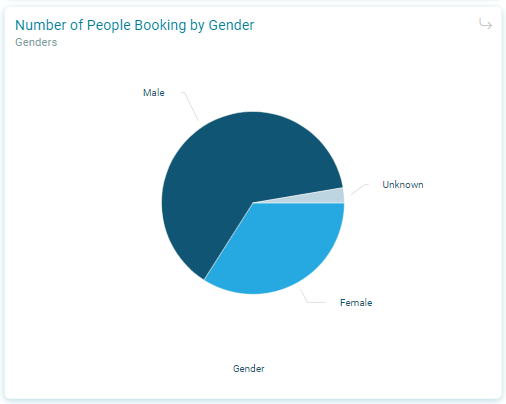
Pie chart
Display categorical data in a circle with the size of each segment representing the category's value.
Donut chart
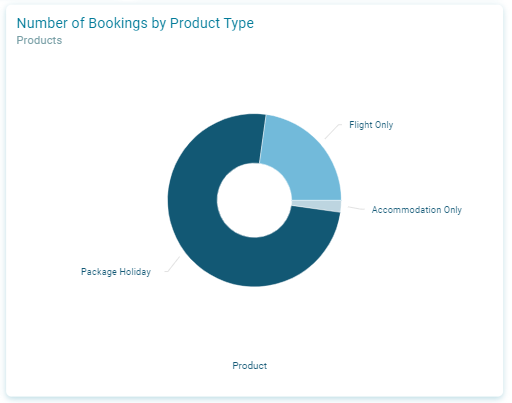
Display categorical data in a circle with the size of each segment representing the category's value.
Line chart
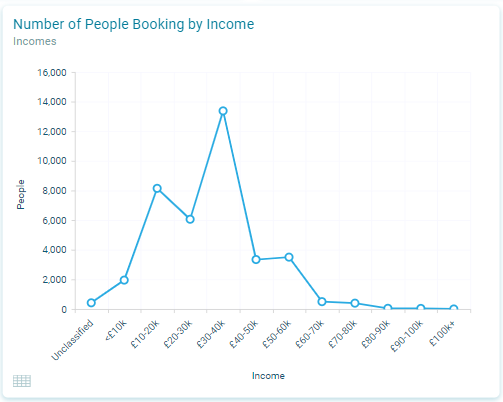
Display categorical data as a continuous line that passes through points defined by the category's value.
Area chart
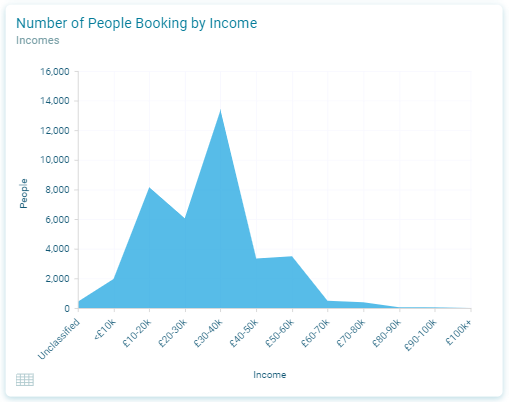
Display categorical data as a continuous line that passes through points defined by the category's value, with the area beneath the line filled.
Radar column chart
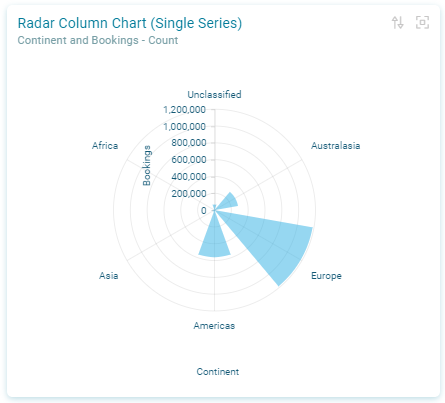
Display categorical data horizontally with the length of each column representing the category's value. The X axis is displayed as a polygon.
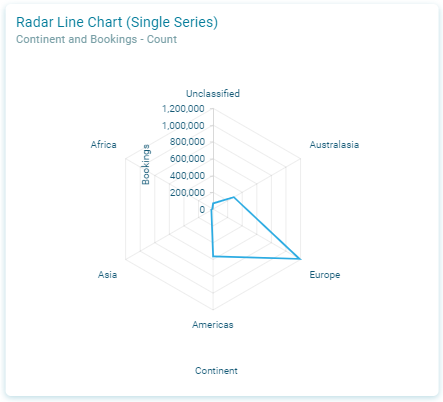
Radar line
Display categorical data as a continuous line that passes through points defined by the category's value. The X axis is displayed as a polygon.
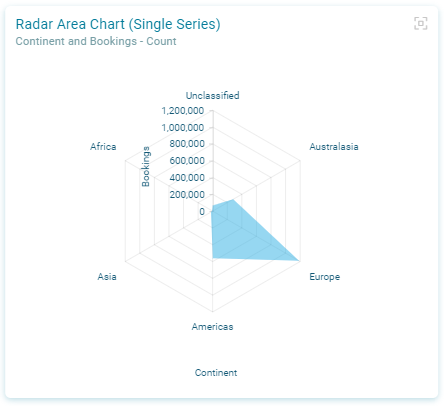
Radar area chart
Display categorical data as a continuous line that passes through points defined by the category's value, with the area beneath the line filled. The X axis is displayed as a polygon.
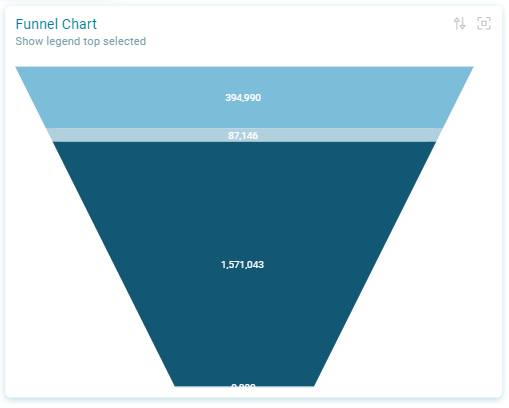
Funnel
Display categorical data in progressively decreasing or increasing proportions that are organised in segments.