Number tiles
Number tiles display single value measures, either as a count or as a calculated aggregation.
You can specify any global currency in settings, independently of user locale. This extends to number tiles using Expression measures or Calculated measures.
Adding measures
Measures determine what value your number tile displays. You can create measures from variables, tables, or audiences.
Adding a variable measure
To add a variable measure:
-
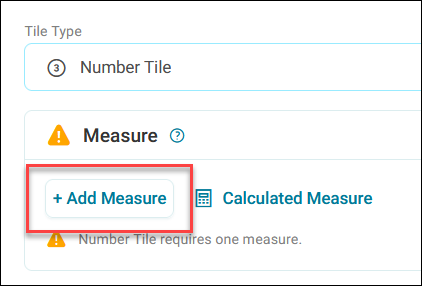
In your number tile side panel, click + Add Measure.
-
Search for and select the variable you want to use.
Note
Only currency or numeric variables are available.
Tip
You can choose to display data from a whole table in your system.
-
Select a function from the Function dropdown (such as Sum, Average, or Count).
-
Select a display format from the Display As dropdown:
- General: Displays the raw numeric value
- Currency: Formats the value with your currency symbol
- Percentage: Displays the value as a percentage
Your tile now displays the calculated value based on your selected variable and function.
Adding an audience measure
Audience measures provide a quick way to track the size of key customer segments.
To add an audience measure:
-
In your number tile side panel, click + Add Measure.
-
Click the Audiences tab.
- Select your Audience.
-
Select a display format from the Display As dropdown:
- General: Displays the raw numeric value
- Currency: Formats the value with your currency symbol
- Percentage: Displays the value as a percentage
Your tile displays the count of records in the selected audience, along with the audience name.
Calculated measures
Create sophisticated metrics by combining multiple measures with mathematical operations using Calculated measures.
Note
When adding audiences to calculations, your system uses the audience count as the numeric value in your formula.
Tip
Use calculated measures to create metrics like conversion rates (purchases ÷ website visits) or average order values (total revenue ÷ order count).
Comparing values
Contextualise your metrics on number tiles by showing how they perform against targets, historical values, or audience counts.
Comparing against a target
Compare current values against fixed targets on number tiles to track progress towards goals and identify performance gaps.
To compare a value against a target:
- Expand the option menu on your number tile.
- Expand the Measure section and your measure.
- Toggle on the Compare option.
- Select Fixed Value.
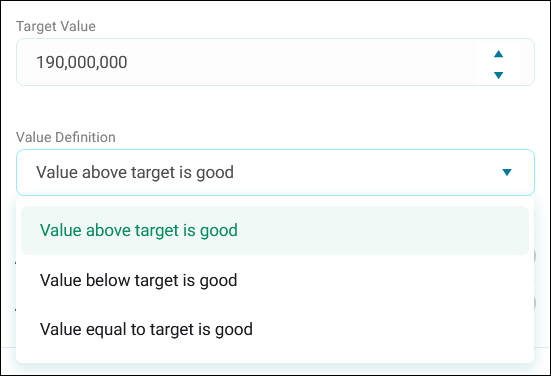
- Set the Target Value as required.
-
Set the Value Definition as required.
- Value above target is good: Higher values indicate better performance
- Value below target is good: Lower values indicate better performance
- Value equal to target is good: Meeting the exact target indicates optimal performance
-
Click Apply.
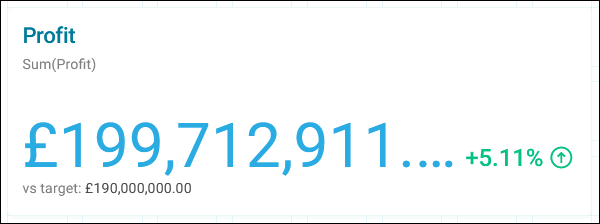
Your tile displays the current value alongside the target, showing how your actual performance compares as a percentage difference.
Comparing against a previous period
Compare current values against historical data on number tiles to track performance trends and identify changes over time. This allows you to measure period-over-period changes using percentage or absolute value calculations.
To compare a value against a previous period:
- Expand the option menu on your number tile.
- Expand the Measure section and your measure.
- Toggle on the Compare option.
- Select Date Range.
- Click + Add Source Period.
-
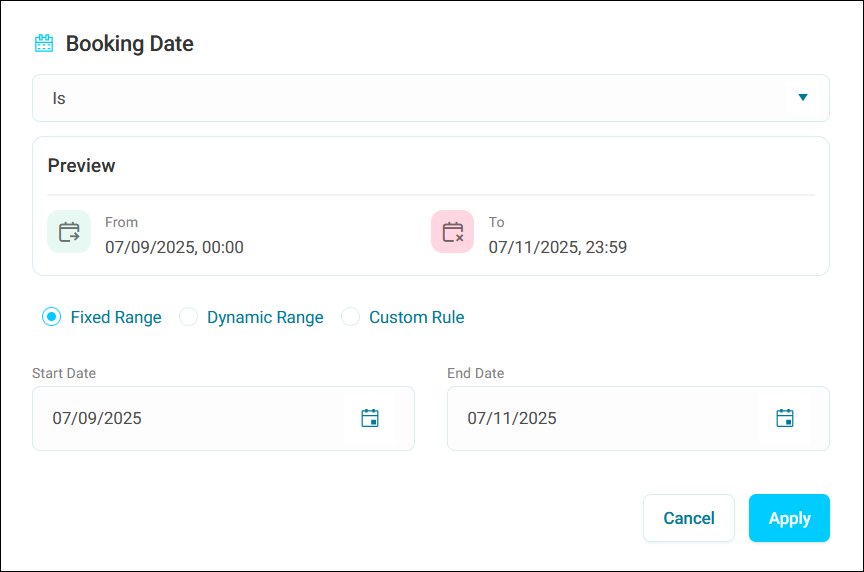
Select your source period variable and configure the timeframe:
- Fixed Range: Set specific start and end dates for comparison
- Dynamic Range: Define a rolling time period relative to the current date
- Custom Rule: Create advanced date logic based on your requirements
Tip
Use dynamic ranges for ongoing monitoring (such as ‘last 30 days’) and fixed ranges when comparing specific campaign periods or business quarters.
-
Click Apply.
-
Expand the Comparison Type.
- Previous Period: Compares to the equivalent time period immediately before your selected period (for example, if you select this month, the previous period is last month)
- Same Period Last Year: Compares to the same time period one year ago (for example, if you select this month, the comparison is to the same month last year)
- Custom Period: Allows you to define a specific comparison period
-
Set the Value Definition as required.
- Click Apply.
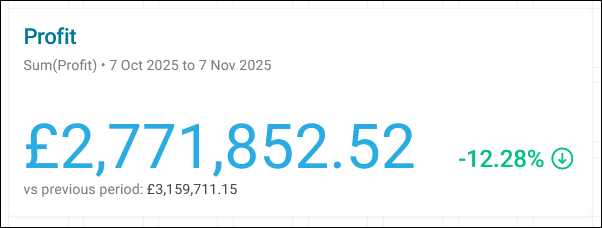
Your tile displays the current value alongside the comparison metric, showing how performance has changed from the previous period.
Comparing against an audience
Compare your measure values against audience counts on number tiles to understand segment performance and calculate percentage differences.
To compare a value against an audience:
- Expand the option menu on your number tile.
- Expand the Measure section and your measure.
- Toggle on the Compare option.
- Select Audience.
- Click + Add Audience.
-
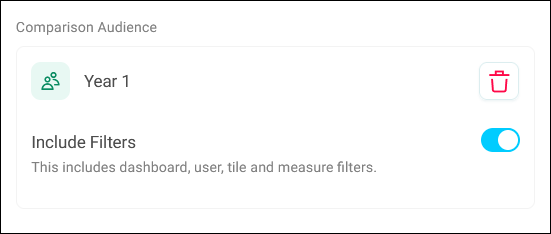
Select your Comparison Audience.
Note
The system only displays audiences that exist on the same table level as your measure.
-
Configure the Include Filters toggle:
- Enabled: The audience count respects dashboard, user, tile, and measure filters
- Disabled: The audience count remains independent of all filtering
Tip
Disable the Include Filters toggle when you need a stable comparison baseline that shouldn't change with dashboard interactions.
-
Set the Value Definition as required.
- Click Apply.
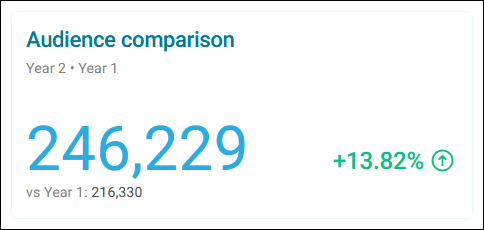
Your tile displays your measure value compared to the audience count, showing the percentage difference between them.
Note
The comparison applies to the records being counted, not to the audience definition itself.
Note
If your comparison shows unexpected results, check whether your audience definition includes linked filters. When filters are not linked, the comparison counts records that match both your audience criteria AND your tile filters independently, rather than counting audience members who also meet the filter criteria.
Expected vs actual number card tiles
With expected vs actual number cards, the target you set for a number card is compared against your actual end number. The result is then displayed on your number card with comparative information and colour-coded visual indicators.
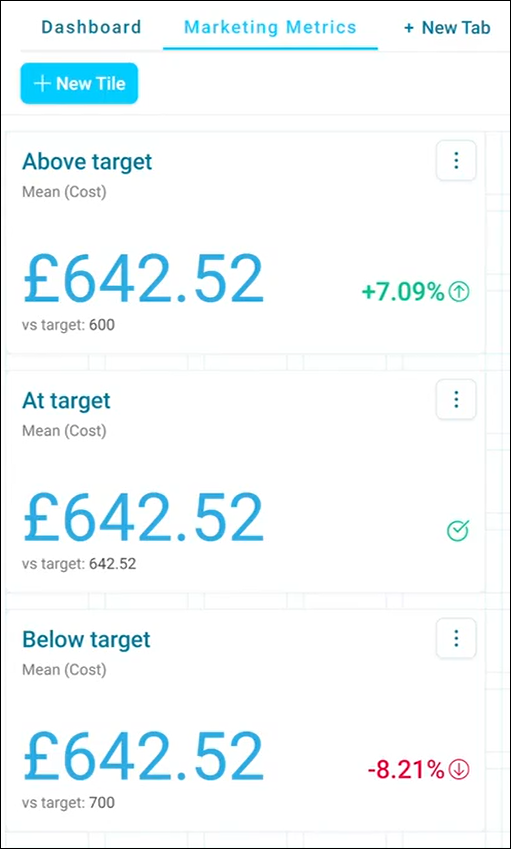
This number card compares a key measure value against a predefined target.
It displays:
- The actual value
- The target value
- The percentage difference
- A visual indicator on whether below or above the target is desirable
The indicator can be colour-coded green or red, based on your goal.
You can also use calculated measures for the comparison value.
Creating expected vs actual number cards
To set up expected vs actual number cards:
- Create or open an existing dashboard.
- Create or edit an existing number card.
-
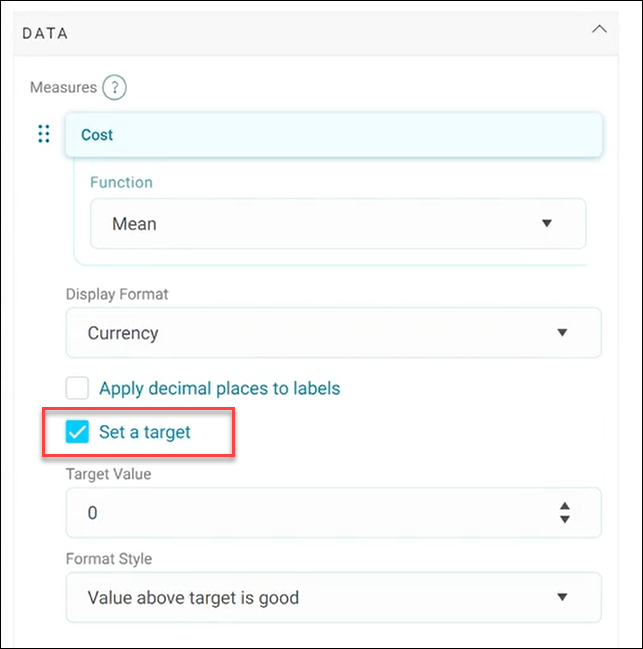
On the Tile Editor, under the DATA > Measures menu, tick the Set a target checkbox.
-
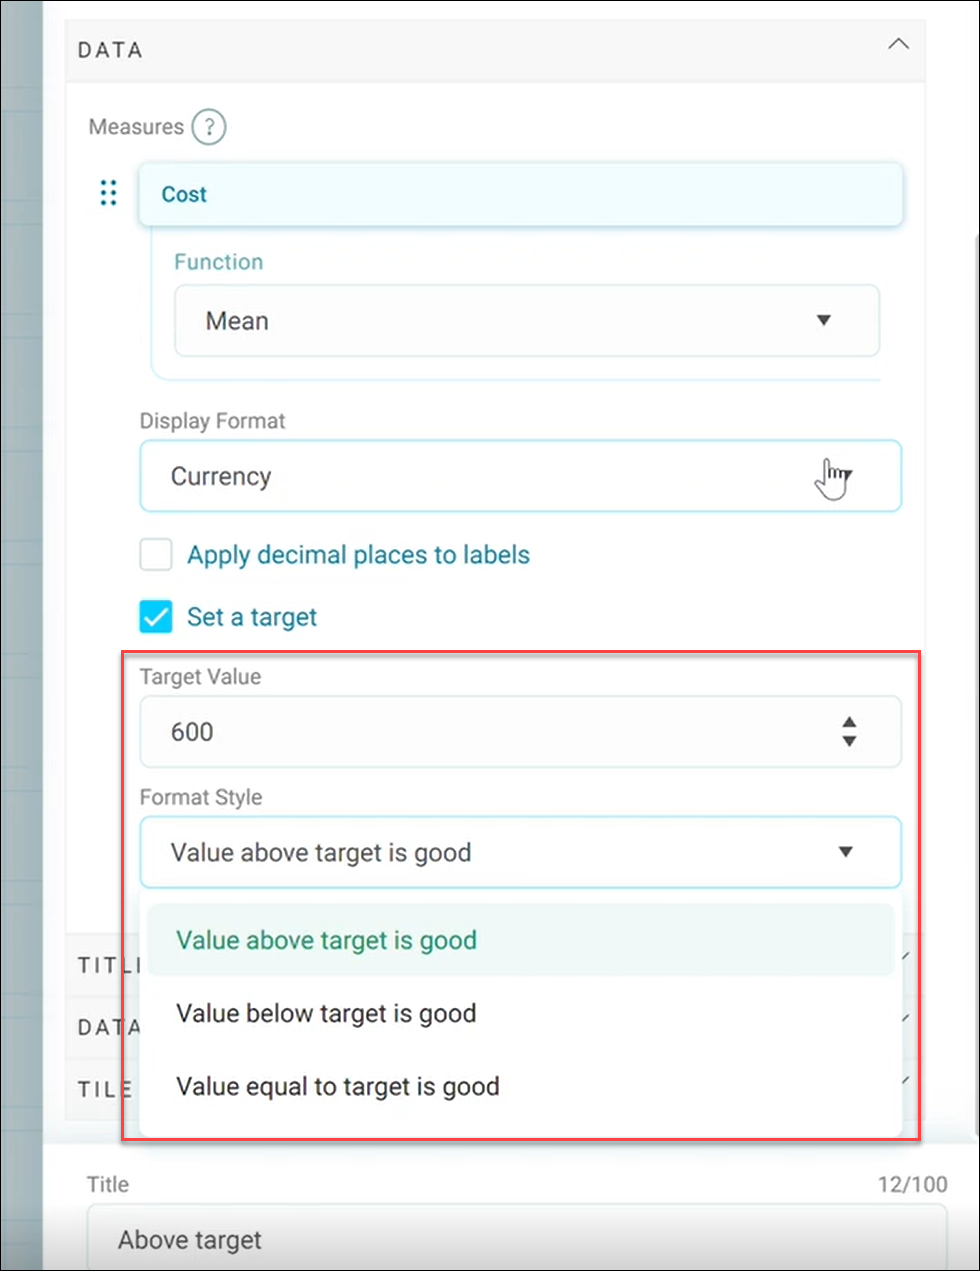
Enter your Target Value and Format Style, see example below.
-
Add your number card Title.
-
Click Apply.
Example use cases
Format style determines whether a higher or lower actual value compared to your target value is ‘good’.
For example:
- In a marketing campaign, if you generate more than expected, that value may be classified as ‘good’.
- In a healthcare scenario, if you have fewer cases of an illness than expected, then that value may be classified as ‘good’.
Depending on what you determine as ‘good’ using the format style drop down, the expected vs actual comparative analysis information is then displayed on your tile with appropriate reinforcing visual indicators.