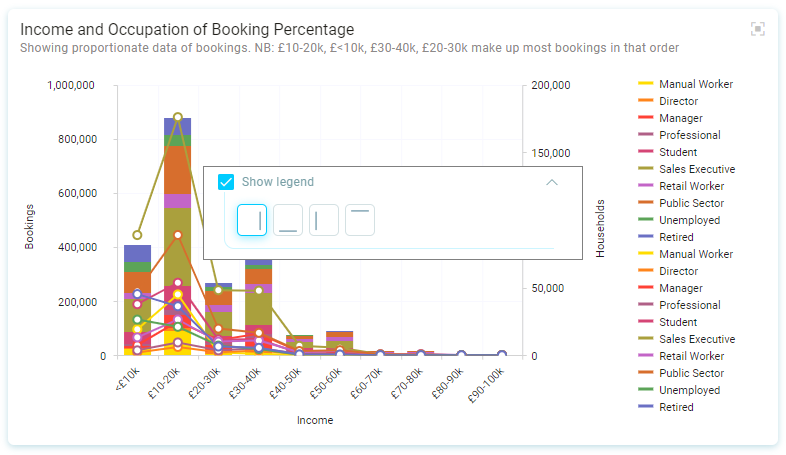
Visualisations
Adding a visualisation to your Dashboard
-
Click the plus
 Add Item icon to open the Tile Editor.
Tip
You can move the Visualisations panel from right to left by clicking the
 icon.
icon. -
Click and select a visualisation type.
-
Enter a Title.
The fields in the panel will adjust to match the tile selected. For example, to display Total Bookings in the Teal Green Holidays demo system using a Number Card:
-
Click + Measure to access and then Search data… or Browse data.
Tip
To identify the total number of records in a table, use the Search option and type the table name — for example, in our demo system, this might be Bookings > People > Communications. You cannot select table items using Browse.
Show underlying data grid - This will provide a link on the tile to view the underlying data.
Omit Unclassified - This will not represent Unclassified data on the visualisation.
Legend
- Select the Show legend option to show the legend.
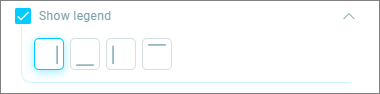
- Click the icon to position the legend.