Derived cube
Calculated Measures are part of Cube functionality and allow the creation of new measures calculated from values in other measures which are part of your Cube display. Through Calculated Measures (full list below), you can satisfy many common requirements, such as calculating ratios and differences, or ranking values across a particular dimension.
- In-Cell Calculation
- Between-Cell Calculation
- Rank
- Percentile
- Period To Date
- Running
- Rolling
- Comparison
- User Defined
In most cases, Calculated Measures work well, with the advantage that a Cube does not need to be recalculated for the results to be displayed. There are, however, some limitations:
- where a particular calculation is not possible, you might have to create a linked series of measures to achieve the relevant effect - e.g. to add together 3 measures you would have to add the first two, and then add the result to the third one in another measure
- some Calculated Measures can take time to process – e.g. ranks on larger cubes
Derived Cube Expressions overcome the limitations above and introduce a range of new calculations to create measures in Cubes with a much higher degree of flexibility. Derived measures can reference other derived measures in the Cube, as long as they appear before them in the list of measures. Calculated Measures can still be used – instead of and/or together with the new derived ones. Due to how each is processed, a Derived Cube Expression cannot, however, reference a Calculated Measure.
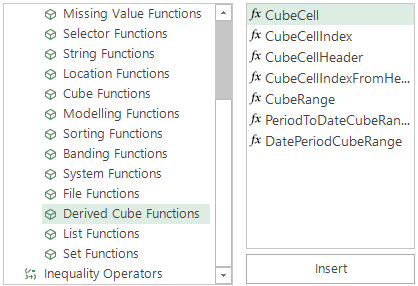
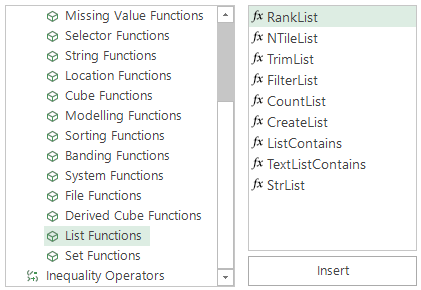
Derived Cube functionality is primarily accessed via the Expression tool and, in particular, using two Expression function sections:
- Derived Cube
- List
To use these Derived Expressions as measures on a Cube, simply drag the Expression into the middle of the Cube display.
See also Apply calculated measures to a cube
CubeCell
This function returns a single value from a single cell in the Cube. There are many ways to use this function, for example to return the value in the current cell, a fixed cell, a total cell, or a relative cell from one dimension, as well as multiple dimensions at the same time.
.png)
.png)
In the above example, the CubeCell function is used to create a measure in which the result is the count of the previous cell for the Region dimension.
Other options include:
Returns the value on the current cell
Returns the value from one of the cells on the given dimension
Returns the value from a cell from somewhere else in the cube
Note
- "measure" is the name of the measure, or the numerical position of the measure in the list
- "cell.dimension" is the terminology used to establish a particular cell on a particular dimension
- "dimension" is the name of the particular dimension
-
The 'cell' will take one of the following values:
Dimension co-ordinates are 1-based and passed as strings
x= category x (absolute reference)0= marginal total+x= current category +x (relative to reference offset cell)-x= current category -x (relative reference to offset cell)+0= current category (relative reference to this cell)
Note
Any dimensions not named are assumed to be the current cell on that dimension.
It is also possible to use this function by not naming the dimensions, meaning that only the 'cell' part is used. Add a second dimension onto your Cube - for example a Cube of Region and Gender:

The cells are referenced to dimensions in the order in which they appear in the Cube – with vertical dimensions first and then horizontal ones. If you change the Cube dimensions and rebuild, the results reflect the new dimensions. Whilst the naming strategy approach is most common, the positional approach can be useful when creating Cube templates.
CubeRange
This function allows you to identify a range of numeric values for a dimension. Because a Cube can only return a single numeric value, the CubeRange function cannot be the outermost in the Expression and is used in conjunction with other functions, such as SUM, MEAN, MIN, MAX, that can do calculations on lists.
.png)
.png)
You can repeat the above steps with the following Expressions to see the effect of different relative cell information:
- all the cells up to the current one
- all the cells up to the previous one
- all the cells up to cell 3
- all the cells on this dimension
-
from the current cell, go back 2 cells and create a list of the following 3 cells
e.g. for 2017 in the above Cube this equates to moving back to 2015 and creating a list that includes 2015, 2016 and 2017
Whilst most typically the CubeRange function will correspond to a set of cells across a single dimension, you can use it to create a 2 (or more) dimensional range by using multiple dimensions in the function.
For example, in a 2-dimensional Cube display of Gender and Region, the following Expression allows you to identify the highest value cell across both dimensions displayed – in this example a count of 138,796 representing Females from the South East (Outside M25) Region:
.png)
.png)
Or, to find the highest count of people across each category row and column:

.png)
Note
CubeRangeFunction - CubeRange (cube$,m,d1,d1size,d2,d2size ...) - selects the cell values from the finished Cube into a list
Measure m referenced by the Cube dimension coordinates - define contiguous ranges d1,d1size,d2,d2size
Dimension coordinates are 1-based and passed as strings
x = category x (absolute reference), "1"=first, "2"=second, ..., "L"=last
0 = marginal total
+x = current category +x - relative reference to offset cell
-x = Current category -x - relative reference to offset cell
+0 = current category - relative reference to this cell
|0 = this whole row along this dimension, size is set to number of cells
Dimension sizes are parsed as numbers - e.g. 2 = 2 cells, 0 = all cells relative to the dimension coordinate
It is also possible to use this function by not naming the dimensions, meaning that only the 'cell' part is used. The cells are referenced to dimensions in the order in which they appear in the Cube – with vertical dimensions first and then horizontal ones. If you change the Cube dimensions and rebuild, the results reflect the new dimensions. Whilst the naming strategy approach is most common, the positional approach can be useful when creating Cube templates.
CubeCellIndex
This function adds a numeric reference to each category in the selected dimension. For example:
.png)
- Create and name the Expression and then drag and drop it onto your Cube as a measure
Each category within the dimension has its own numeric reference:
.png)
These "CubeCellIndex" reference numbers can then be used to refer to categories in other Expressions – e.g. an IF statement:
.png)
The above Expression compares the value of each referenced cell (from cell reference 14) with that of cell reference 14 – i.e. January 2014. See 'Comparison to Point in Time 1' in the Cube below.
Alternatively:
.png)
This Expression compares the value of each referenced cell (backwards from cell reference 14) with that of cell reference 14 – i.e. January 2014. See 'Comparison to Point in Time 2' in the Cube below.
.png)
Note
Only the original referenced dimension is needed for the calculation. In the screenshot below, where Gender has been added as a second dimension on the Cube, you can see the numeric reference is the same for each gender category.
.png)
CubeCellHeader
You can use the CubeCellHeader function to reference a dimension's category code or description as a string. Because a Cube can only return a numeric value, the CubeCellHeader function cannot be the outermost in the Expression and is likely to be used in conjunction with an IF or CASE statement to do a different calculation based on the code or description of the dimension value.
.png)
.png)
The above example demonstrates how to create a reference year from the Banded Booking Date (Months) dimension which might then be used to carry out more complex analysis, such as weighting the average cost of a holiday booking relative to a particular year. Note that StrNumber is used so that we can display this in our Cube.
CubeCellIndexFromHeader
This function returns the numeric index of the cell with the given header on the given dimension. An optional final parameter allows you to specify to match to the category code or its description; the default is code. The created reference can then be used to carry out more complex analysis, such as comparing the number of people with bookings to New Zealand against those who have been to Australia, and is particularly useful when there is the potential for the order of cell references to change over time – e.g. more destination categories added resulting in a change to the original cell index positions.
To identify and match to the description for the Destination of New Zealand:

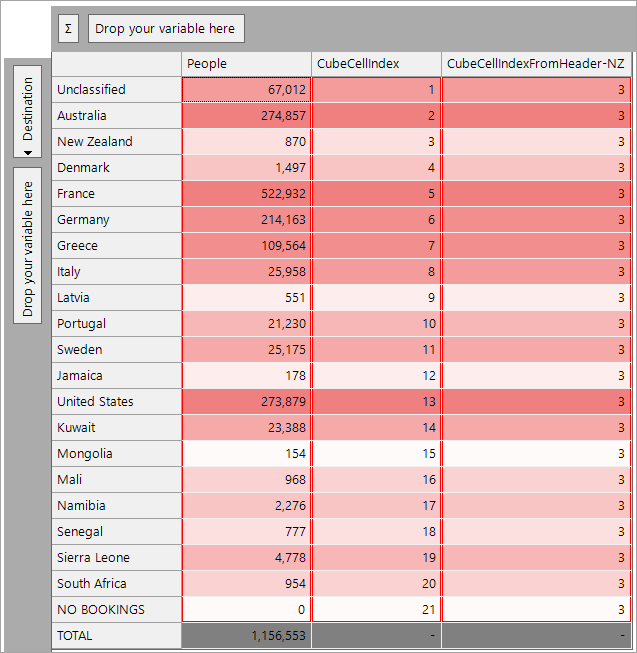
The above example shows the Destination variable as the dimension, the CubeCellIndex position for each category, and the result of adding the CubeCellIndexFromHeader to return the specific index for New Zealand. This can now be used to do a variety of different calculations.
PeriodToDateCubeRange
You can do period-to-date calculations using this function. For a banded date dimension, this will return a numeric list comprising the cells from the start of the current period to the current cell. Because a Cube can only return a numeric value, the PeriodToDateCubeRange function cannot be the outermost in the Expression and is used in conjunction with other functions, such as SUM, MEAN, MIN, MAX, to do different calculations.
For example, to calculate year-to-date values:
.png)
.png)
Note
Where:- "measure" is the name of the measure, or the numeric position of the measure in the list of measures
- "dimension" is the name of the dimension referred to. You cannot refer to the dimension by numeric position in this function. There are some restrictions to the dimension: It must be a date dimension and must be a continuous dimension (i.e. each value is the next date in the calendar). If the dimension fails any of these validations, the result will be a missing value
- "number" will usually be 0 as this means going back to the start of this period. The value of 1 would be to go back to the start of the previous year. The most usual case for a non-zero number would be to say go back to the start of a 6-month period
- "periods" refers to one of the following values - "weeks", "months", "quarters", "years". A shortcut of the first letter will also work here
DatePeriodCubeRange
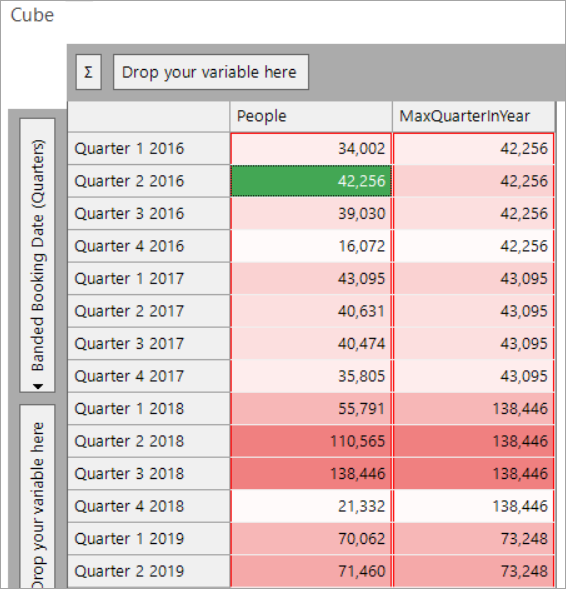
You can do date period calculations using this function. For a banded date dimension, this will return a list comprising numeric values from the specified range in the Cube. Because a Cube can only return a numeric value, the DatePeriodCubeRange function cannot be the outermost in the Expression and is used in conjunction with other functions, such as SUM, MEAN, MIN, MAX, RANK to do different calculations.
For example, to calculate the relationship of this quarter to the maximum of any quarter this year:

Note
Where:
- "measure" is the name of the measure, or the numeric index of the measure in the list of measures
- "dimension" is the name of the dimension referred to. It must be a banded date dimension where the date in each cell follows the previous one
- "periods" refers to one of the following values – "days", "weeks", "months", "quarters", "years". A shortcut of the first letter also works – d|w|m|q|y
List functions
To enable the creation of Derived Cube Expressions, the following List functions are available.
RankList
This function can be used to find out the rank of a value in a list of values. Although not restricted to the case described here, the most common use is to rank Expressions in Derived Cubes.
Where:
Parameter 1 is the number to rank
- if this number is not in the list then the result will be missing value
Parameter 2 is the direction of ranking
- either "ascending" or "descending"
- single letter "a" and "d" can be used
Parameter 3 is the way to break ties
- either "competition" or "dense" are the allowed strategies
- single letter "c" and "d" can be used
Parameter 4 is a numeric list
- currently such a parameter uses one of the CubeRange/PeriodToDateCubeRange Expression functions
Example
To rank across a whole dimension:
- Create a Cube and add Income as a dimension
-
Create the following Expression:
.png)
-
Drag the Expression into the middle of your Cube and build:
.png)
NTileList
This function can be used to find out the Ntile of a value in a list of values. Although not restricted to the case described here, the most common use is for calculating Ntiles in Derived Cubes.
Where:
Parameter 1 is the number for which to work out the Ntile
- if this number is not in the list then the result will be missing value
Parameter 2 is the direction of ranking
- either "ascending" or "descending"
- single letter "a" and "d" can be used
Parameter 3 is the number of Ntiles
- typically this is 100, but you can choose any numeric you like
Parameter 4 is a numeric list
- currently such a parameter uses one of the CubeRange/PeriodToDateCubeRange Expression functions
Example
To create NTile across a whole dimension:
- Create a Cube and add Income as a dimension
-
Create the following Expression:
.png)
-
Drag the Expression into the middle of your Cube and build:
.png)
FilterList
This function takes a list of values and removes some of its values. The primary use case is to filter outlier values from a list of values.
- FilterList reduces the set by selecting based on value
-
FilterList (Lower,Upper,Include,
{List}) - LIST- 'lower' and 'upper' are both numeric values
- if Include is true then include Lower <= x <= Upper, otherwise exclude this range
- the List parameter is created from a CubeRange/PeriodToDateCubeRange Expression function
Example
To find the max of Destinations but filter out values 100000:
- Create a Cube and add Destination as a dimension
-
Create the following Expression:
.png)
-
Drag the Expression into the middle of your Cube and build:
.png)
TrimList
This function takes a list of values and removes some of its values.
- TrimSet reduces the set by selecting based on number of items
-
TrimList(Lower,Upper,Include,
{List}) – LIST- if 'lower'/'upper' is an integer, drop this exact number from bottom/top of sorted set
- if 'lower'/'upper' is fractional (0 < x < 1), drop this fraction from bottom/top of sorted set
- fraction rounds down to nearest whole number of items
- if include is true then include Lower <= x <= Upper otherwise exclude this range
- the List parameter is created from a CubeRange/PeriodToDateCubeRange Expression function
Example
To find the max of Destinations after removing the top-most / bottom-most value:
- Create a Cube and add Destination as a dimension
-
Create the following Expression:
.png)
-
Drag the Expression into the middle of your Cube and build:
.png)
CountList
This function allows you to count the number of elements in a given list.
Example
To create a simple count list, first create the following Expression:
.png) - gives a value of 2
- gives a value of 2
Example
To count the number of values on a Cube dimension with a value below 100,000:
- Create a Cube and add Destination as a dimension
-
Create the following Expression:
.png)
-
Drag the Expression into the middle of your Cube and build:
CreateList
This function allows you to create a list object from a set of values or lists. The return type of the function is a list and it therefore needs to be used inside a function that acts upon a list.
Example
To create an average from the horizontal and vertical slice through a Cube's cell:
- Create a Cube with a dimension of Destination (vertical) and Gender (horizontal)
-
Create the following Expression:
.png)
-
Drag the Expression into the middle of your Cube and build:
.png)
ListContains
This function allows you to test whether a given list contains one of a number of values. The return value is 0 if none of the test values are matched or, otherwise, the index of the matched value (i.e if it matches 1st value = 1, 2nd value = 2, etc).
Example
To create a simple ListContains example:
.png)
returns 2
Example
Based on a Cube, the following Expression returns 1 if the people in that cell have been to all 20 destinations between them, or 0 otherwise:
- Create a Cube with a dimension of Income (vertical) and Occupation (horizontal)
-
Create the following Expression:
.png)
- Right-drag the Destination variable into the middle of the Cube and add Count Distinct(Destination) as a statistical measure
-
Set the Omit Zero Axes property off
.png)
-
Drag the Expression into the middle of your Cube and build:
.png)