Behavioural modelling updates
Q2 2026
Extended behavioural modelling selection scenarios
Behavioural modelling identifies groups of people who have historically exhibited a specific behaviour - for example, responding to a campaign. You can then analyse how a group's earlier behaviour differs from others, with the aim of predicting which additional people within your dataBase are likely to behave similarly.
Previously, the behaviour being modelled had to involve an active event, such as a response. You can now also model inactive events - the absence of an action - and optionally follow this with any number of subsequent events.
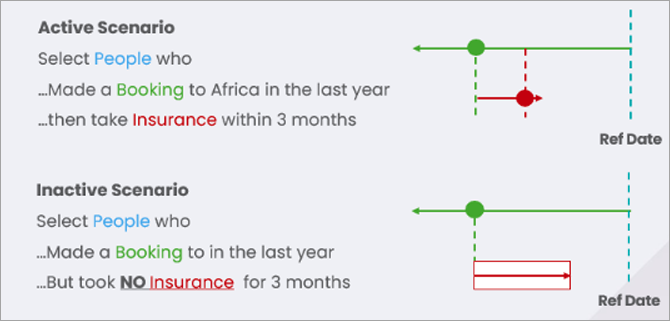
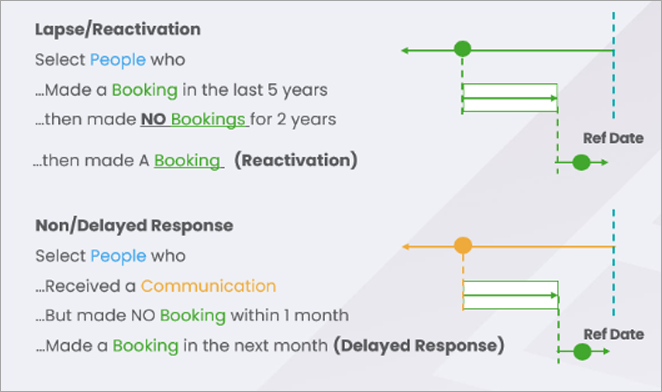
This enables new modelling scenarios to be modelled and allows FastStats to identify people who are likely to exhibit these behaviours, including:
- Lapsing - e.g. People who make a donation but then do not make a donation for 2 years.
- Reactivation - e.g. People who have lapsed but then make another donation.
- Non-responses - e.g. People who receive a communication and do not make a purchase.
-
Delayed responses - e.g. People who initially have not responded but then make a response.
Further scenarios
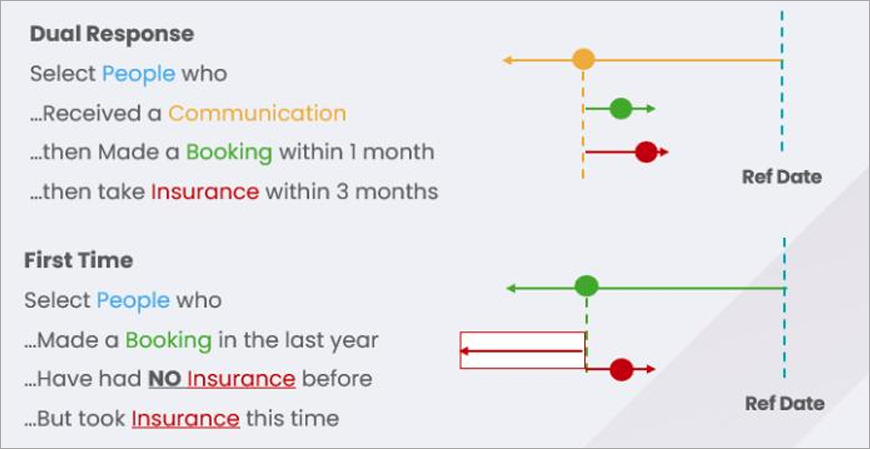
Event sequences are no longer limited to a single linear chain. You can now:
- Allow multiple events to follow the same event.
- Define events as occurring before another event.
This enables scenarios such as:
- Multiple response - e.g. A communication followed by both a booking and the purchase of an insurance policy.
-
First-time response - e.g. A communication followed by a purchase of a product that the person had not bought before, or a supporter making a 'regular' donation for the first time after only making ad-hoc donations previously.
Set-up
Inactive scenarios are set up in the same way as active ones, but use the option "No" to indicate an inactive event.
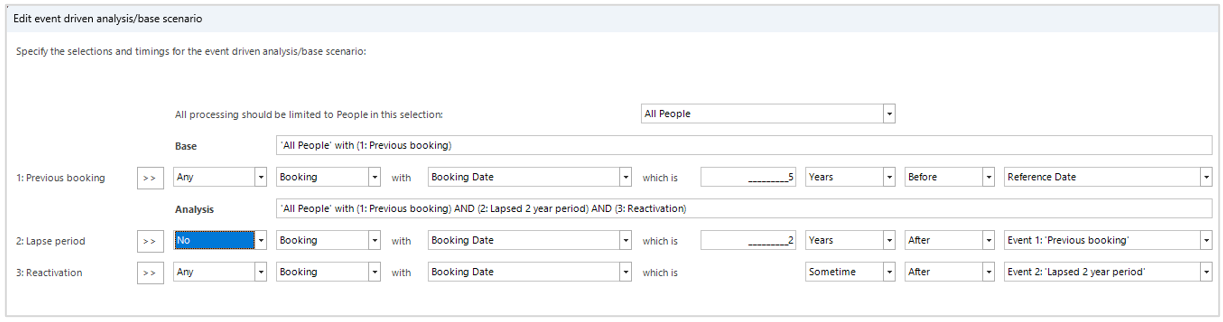
The inactive period must be at least as long as the time specified, but could be longer. The "point-in-time" associated with this event is the "last date checked and free of transactions" (for example, 2 years after event 1). When another event is set as following the inactive period, it can be any time after this "check date".
Implementation and limitations
Inactive events
Active events use exact calendar units - for example, 1 month after 1st February = 1st March.
Inactive events approximate all units into days - for example, no response within a month from 1st February checks 30 days, reaching up to 3rd March.
The approximations used always convert units to a whole number of days, rounding down where necessary. So:
1 month = 30 days (30.4)
2 months = 60 days (60.8)
3 months = 91 days
As a result - and as expected - 12 months = 365 days. Leap years are handled so that 3 years = 1095 days, but 4 years = 1461 days.
Inactive events must have a fixed time period - for example, no donation for 2 years. You cannot use the open-ended, "sometime after" option.
Many-to-one events
The algorithm used currently may only find a subset of the people who match the given event sequence. Everyone selected will match the sequence, but other people with the sequence may not be selected.
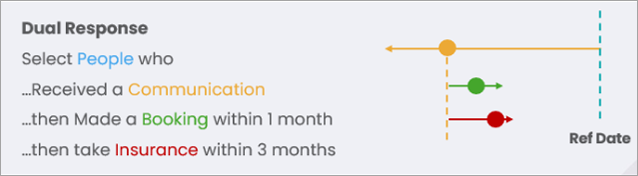
For example, the algorithm will find a pair of transactions where the conditions for Event 1 and Event 2 are satisfied. It then checks to see if Event 3 is also satisfied, but it's possible that Event 3 could still be satisfied if a different pair was chosen. For modelling purposes this is usually fine, as the overall modelling process is to compare an Analysis group of people who meet the conditions of the event sequence against a Base group, and this doesn't need to be everyone who meets the conditions.
To maximise the size of the subset selected, make Event 2 the more restrictive condition relative to Event 3. This means that, once an Event 1-2 pair has been found, it is more likely also to pass the conditions for Event 3.
Maximum 5 years analysed
When determining if someone matches an event sequence, you can analyse a maximum of five years' worth of data for each person for each event. The time interval you set in the dialogue informs how much data is needed. For example, to select people who made a donation in the last five years, after two years of inactivity, you actually need to check seven years of data to evaluate the second event. In such cases, a warning is issued in the log. When the data is truncated to 5 years, a person may still be selected if they exhibit the events within that time.
The warning is:
6875 individual level records have some event level data that has been truncated. Each event can only process data spanning up to 1920 days (5.25 years) per individual. Only the earlier events will be analysed when considering an individual for selection.
This is not necessarily a problem as it will depend on the definition of the event whether the truncated data is sufficient to make the selection.
To avoid this warning, limit the possible events per individual by either reducing the interval between events or by adding criteria to restrict the event selection.
Custom event names
By default, events are called Event 1, Event 2, etc. but you can now customise the names and descriptions using the >> button. The description updates automatically from the name unless you edit it manually.
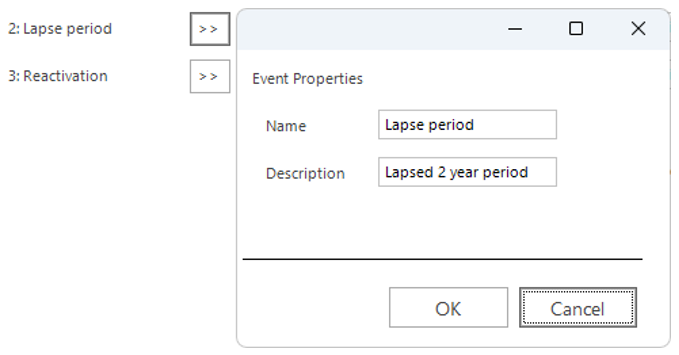
To return to the default description, simply delete the custom description.
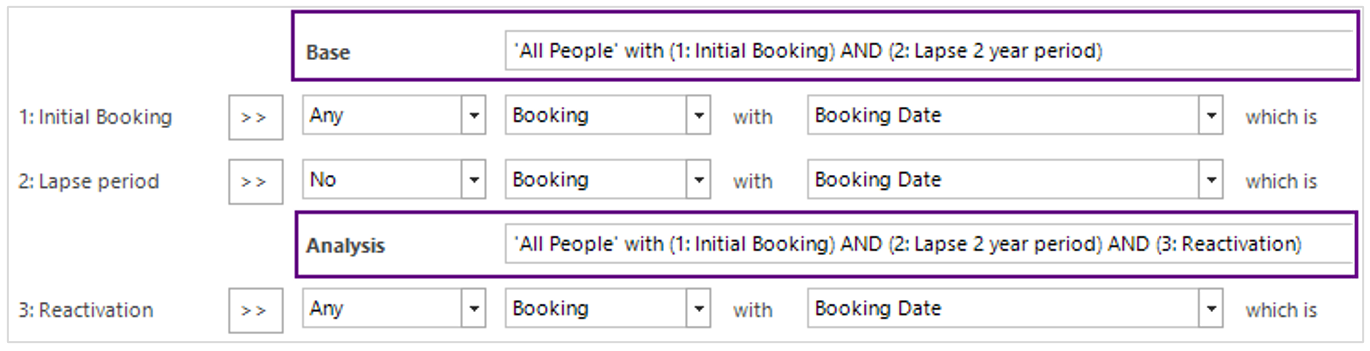
Unless you have manually changed them, the Analysis and Base selection names update automatically when the event names change. To return to the automatic defaults, simply delete the entire manual description.
The position of the boundary between Base and Analysis determines what behaviour is being analysed. In the screenshot above, the model is trying to identify differences in behaviour between people who reactivate and those who simply lapse. You can move events up and down the sequence using the arrow buttons.
Auto-generated selections
The sequence of events defined in the selection scenario dialogue are converted into a pair of "Selections" which are then used to define the profiles used in the model. You can see these selections via the "View a Copy" option:

Alternatively, right click on the Selection tab from within the Modelling Environment:

This launches a selection that identifies people matching the event sequence:
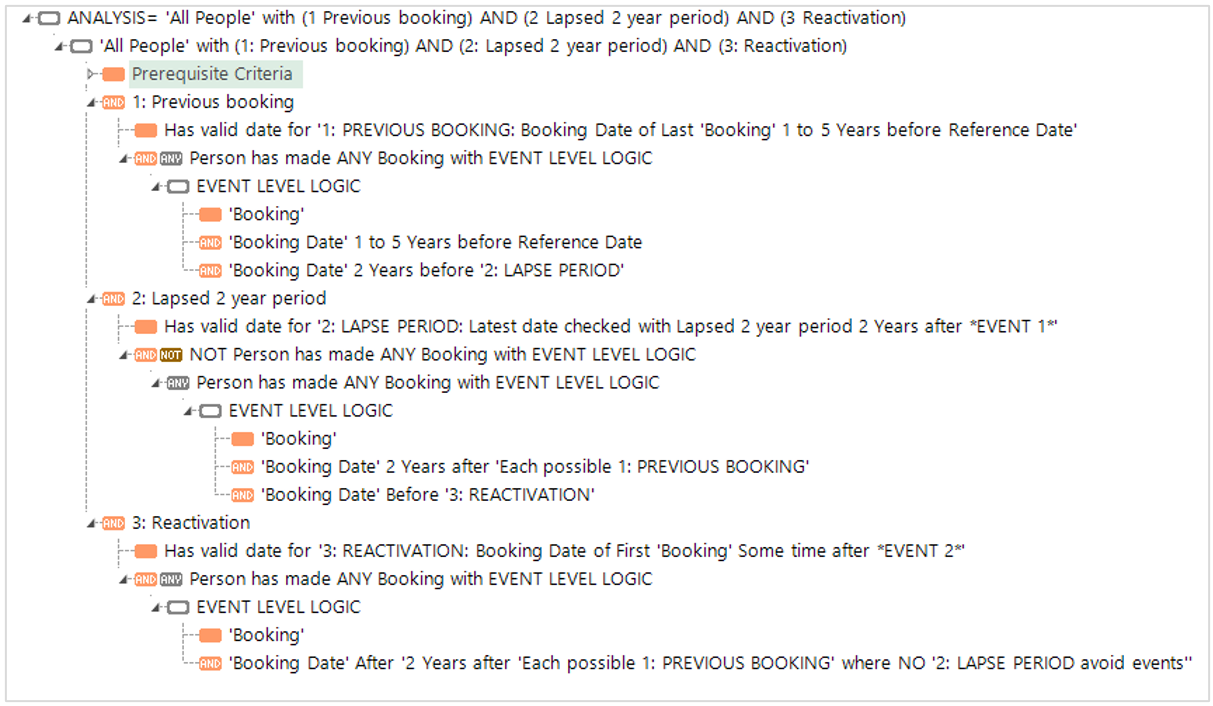
The selection tree combines complex expressions that make the selection with dummy expressions that help to make the overall logic clear.
The top-level nodes contain the logic necessary to select the correct people - those who exhibit the defined sequence of events:


Note
You should not change these complex, inter-related expressions, aggregations and filter queries.
The remaining nodes serve only as labels to indicate how the events are defined. If you click on one of these, it is simply a dummy expression which always returns a 1 or 0, and serves to describe how the event sequence has been defined.
Data grid options
You can use a data grid to show the detail behind your selections.

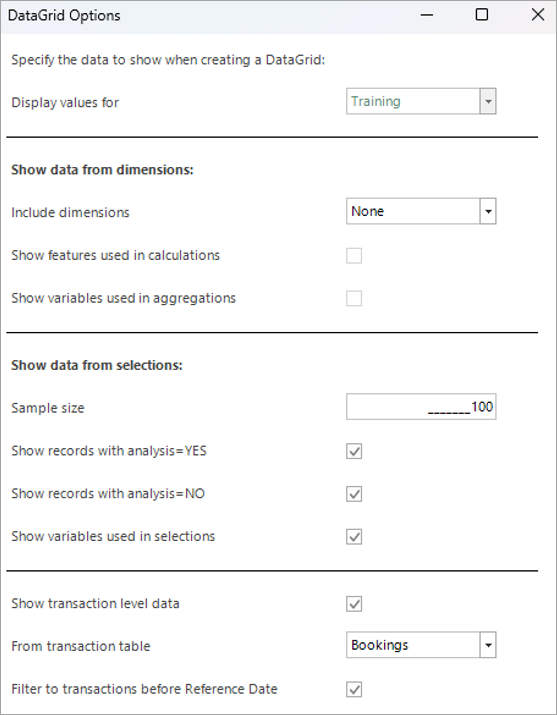
The options for displaying data relating to the dimensions allow:
- Features which are calculations of other features to display these too.
- Transaction level variables used in any aggregation feature.
You can also:
- Specify how many records the Analysis or Non-Analysis to display.
- Automatically extract and display any variable used in the event criteria.
- Set the level of the data grid to one of the transaction tables (or leave at the Person level).
- Add a transaction filter to limit records to before the reference date.
Data is displayed for each of the points-in-time associated with each event, using the custom event name, if specified, along with any transactional variables.
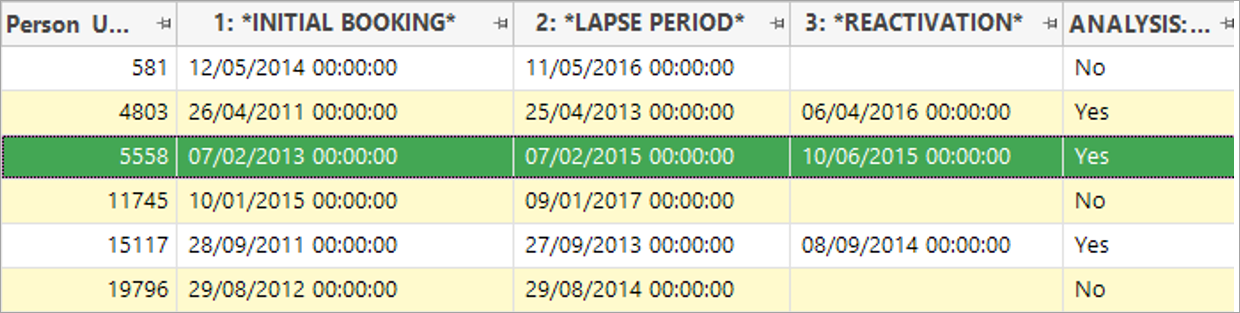
In the above example, all people have had a 2-year lapse period. Note that the date for the second event is the "last date checked and free of transactions" and is, therefore, two years after the initial booking. People in the Analysis selection have the additional reactivation event which corresponds to a subsequent booking.
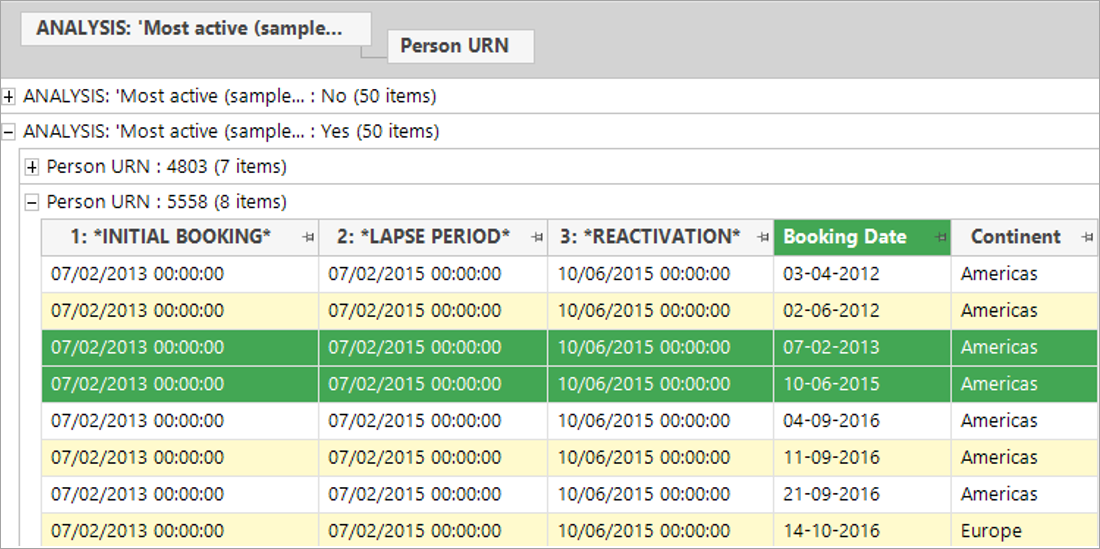
By changing the level of the data grid to bookings, it is possible to see the reason why people have been selected.
This individual had:
An initial booking on 7th February 2013, followed by at least a 2-year lapse period with no bookings, followed by a reactivation booking on 10th June 2015.
Note
Launching a data grid directly from the Selections tab adds columns from the selection without the need to add dimensions first
Q1 2026
Modelling templates support for unlimited variables
Note
Work is ongoing to make behavioural modelling templates available in Apteco Orbit. Until then, experienced FastStats users can access and use this functionality through the FastStats Modelling Environment. Please note that both the features and the user interface in this release are still being developed and will continue to improve in future updates.
The first iteration of behavioural modelling templates (released in Q3 2025) allowed you to export dimensions from one system and import them into another. The template was limited to one instance of each type of parameter needed to create behavioural modelling dimensions.
For example:
| %GroupingTable% | People |
| %TransactionTable% | Bookings |
| %TransactionDate% | boDate |
| %TransactionValue% | boCost |
| %TransactionType% | boDestination |
| %TransactionCategory% | 01 |
This was sufficient for templating models within the "3D" scenario - systems used for a proof of concept, which only held the transaction type, date and value variables for one transaction table against an anonymised person ID.
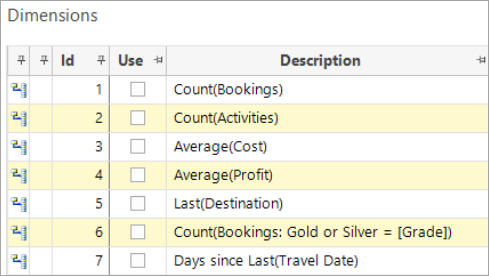
It is now possible to template models which include dimensions using any number of variables from multiple transaction tables.
For example:
| %GroupingTable\_1% | People |
| %TransactionTable\_1% | Bookings |
| %TransactionDate\_1.1% | boDate |
| %TransactionDate\_1.2% | boTravel |
| %TransactionValue\_1.1% | boCost |
| %TransactionValue\_1.2% | boProfit |
| %TransactionType\_1.1% | boDestination |
| %TransactionType\_1.2% | boGrade |
| %TransactionCategory\_1.2.1% | G |
| %TransactionCategory\_1.2.2% | S |
| %TransactionTable\_2% | Activities |
The templates are still exported and imported as before:
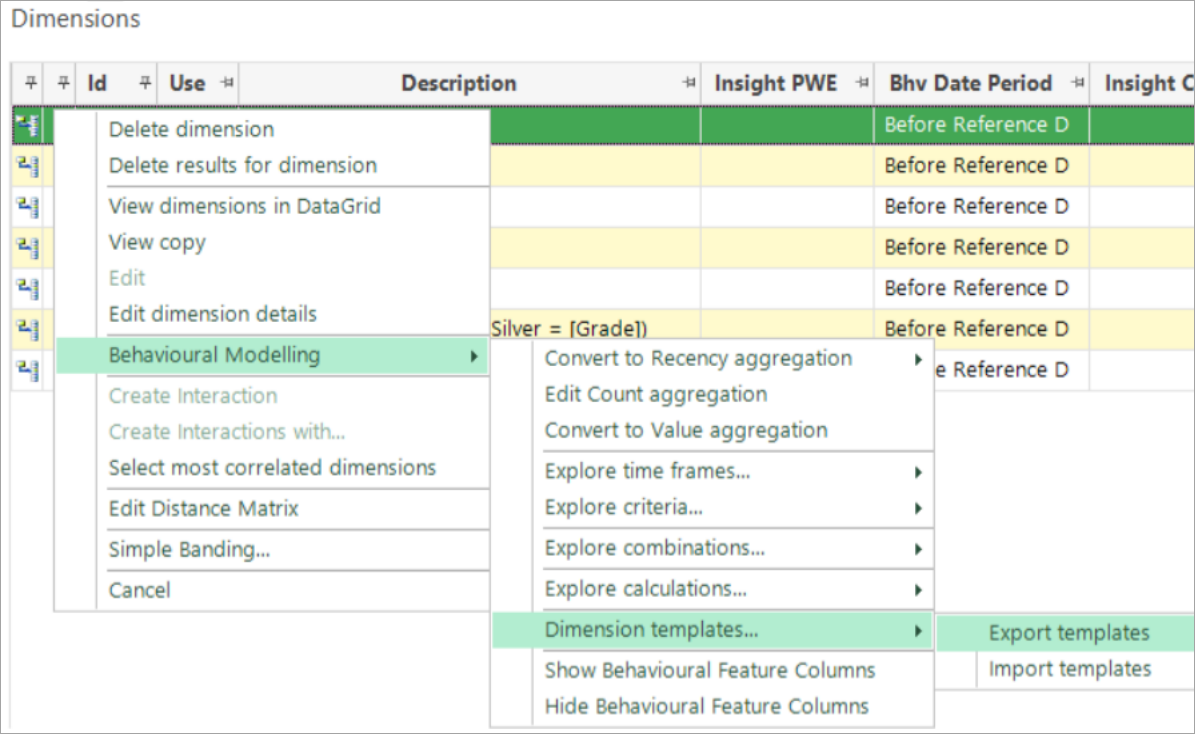
See Behavioural modelling templates for more details.
Validation of the variable and table names used in a template takes place during the import, with a list of valid table names provided to help you achieve the correct format.
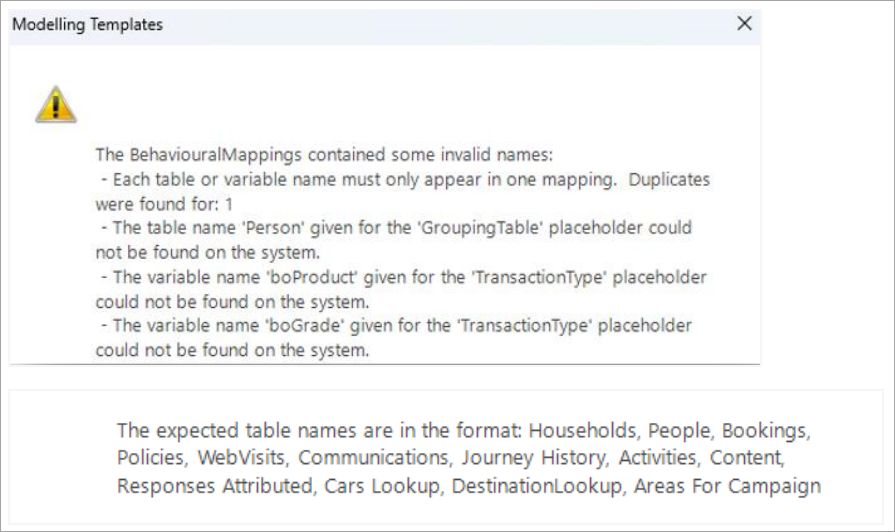
Categories are not validated on import - this occurs when the behavioural features are used.
More flexible definition of event-driven models
When defining an event-driven modelling scenario, set-up requires you to select a point-in-time which determines the transactions used when assessing the behaviour of, and looking for differences to explain, those in the analysis selection. To avoid potential misinterpretation of differences in behaviour caused by the scenario definition rather than the differences being predictive, for cases where the analysis event was explicitly after the reference date, you could only set the point-in-time to be the reference date. To provide greater flexibility, you can now choose your point-in-time in all cases, but you are prompted in scenarios where caution is necessary. This is especially useful when creating a churn model.
Churn model example
A churn model differs from a standard model in that the behaviour being predicted is not the presence of some event (e.g. a Booking or a Response), but rather the absence of any event!
You can set the model up by creating a virtual variable for the 'lapse date' on each transaction which is not then followed by a subsequent transactions within a defined period. That might - for example, be no further transaction within 12 months of making a charitable donation or, here, within 2 years of making a holiday booking. The lapse date would be the day before the end of the time window.
Note
More details on how to set the model up are provided below.
In this example, the model scenario is defined as:
- Base = People with a Booking Date in the year before the reference date.
-
Analysis = People with a Lapse Date up to 2 years after the booking.
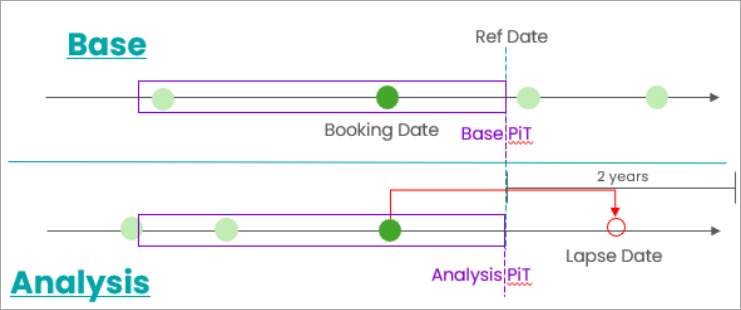
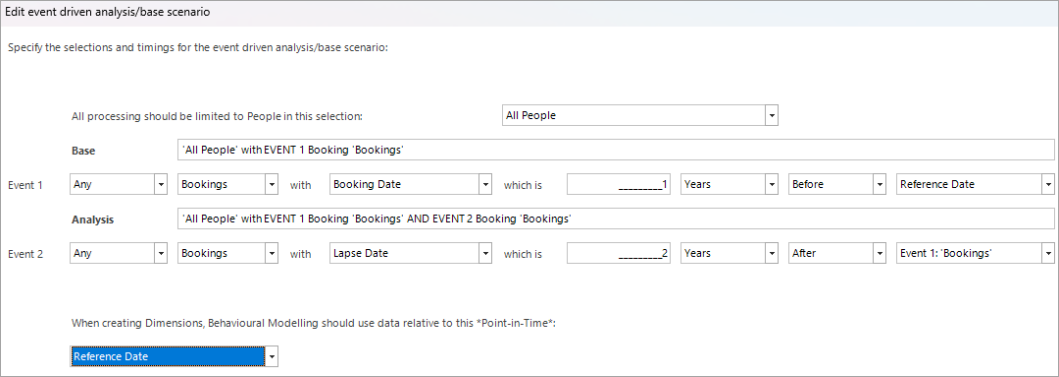
In this situation it is very helpful that you can look for differences between the analysis and base during the time frame highlighted before the defined point-in-time. The model uses these differences to predict who is likely to lapse.
Warning issued
The equivalent scenario defined using standard events demonstrates the need for the warning that displays.
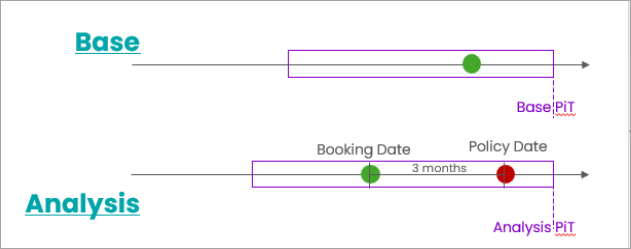
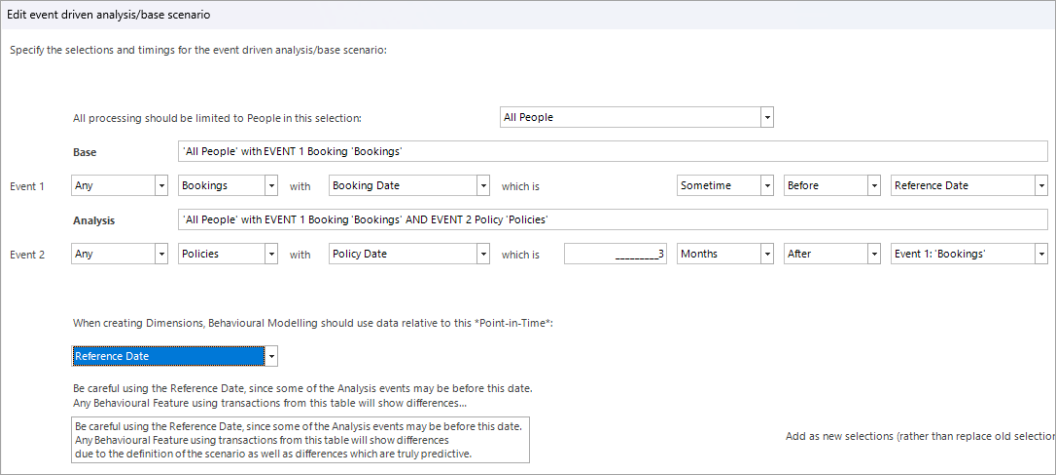
In the above scenario, the analysis event - the purchase of insurance - is very likely to occur before the reference date, since it is only a maximum of 3 months after the booking. If you make a behavioural feature on the Policies table - such as Count of previous insurance - the analysis selection is very likely to have have at least one extra insurance transaction, but this transaction relates to the method of selection and is not a prior predictive behaviour that explains why someone is part of the analysis group.
Ignore the warning
You can still choose to create a model when there is a warning. For example, the impact of one additional transaction is minimal if people generally have many transactions. Note, however, that in a charity donation churn scenario, where many people only have one donation, this extra transaction can distort the model.
The warning relates only to behavioural features based on transaction that are used in the analysis event. In this Holidays example, any feature based on insurance policies will be distorted, but features that are not related to insurance policies will not be distorted if they are not linked to how the analysis selection is made.
In this example, the 'lapse date' is, by definition, 2 years after the booking date and it is, therefore, not possible for it to occur before the reference date.
Removing the warning
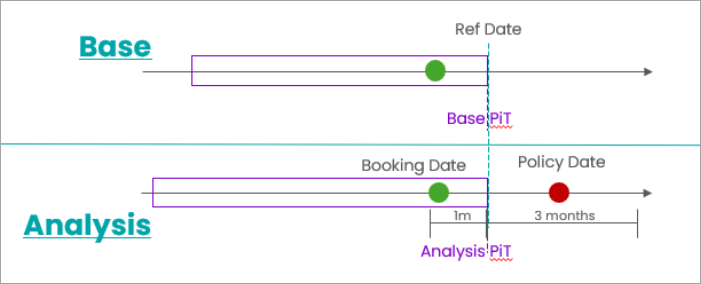
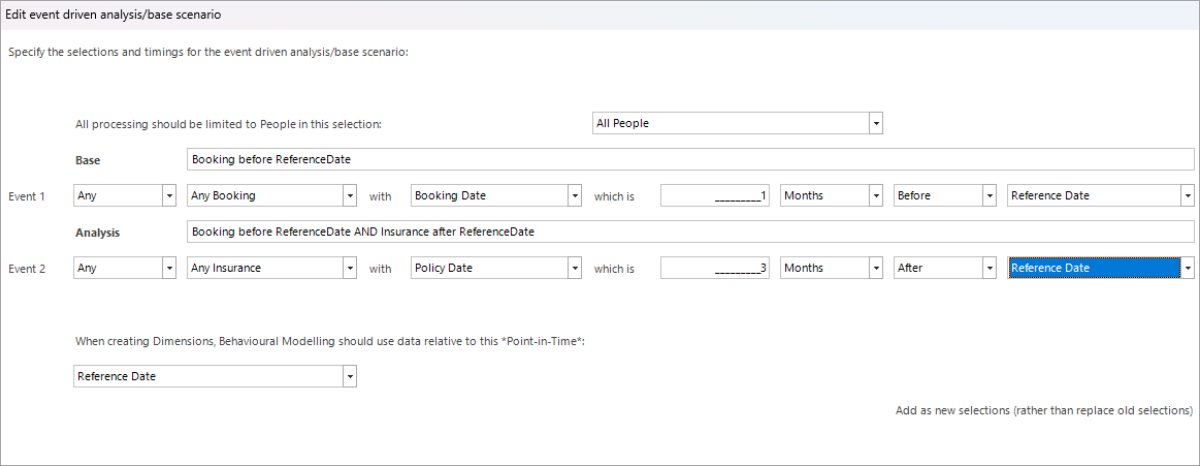
In scenarios where the definition is explicit that all the analysis event fall after the reference date, no warning is displayed, as there is no longer a risk. This may or may not be viable, depending on the scenario. The sample below illustrates the point, but is not particularly useful since the interesting behaviour, that explains why someone takes out insurance, could easily occur after the reference date and, consequently, would be missed.
As in previous releases, no warning is issued if the events themselves are used as the point-in-time.
For example:
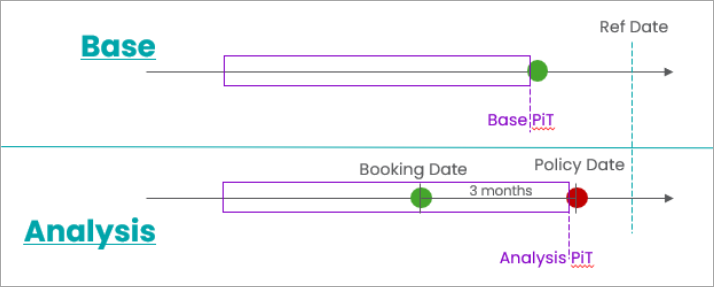
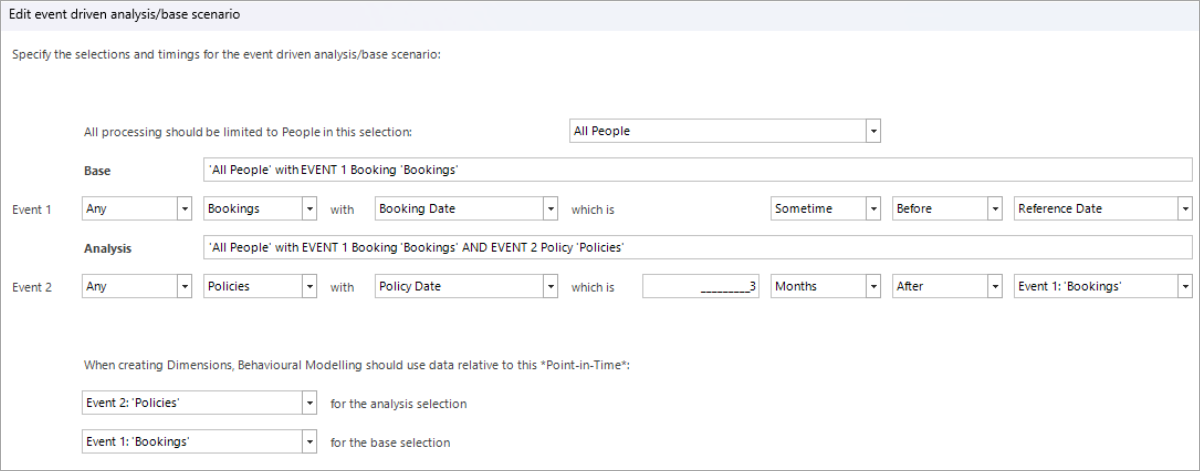
By analysing all the behaviour before the policy date, the model is more likely to discover differences which can predict who will purchase life insurance - e.g. people who have reserved activities such as 'dangerous' sports during their holiday.
Inclusive point-in-time
In models where the "point-in-time" is based on one of the events, the transactions used for the behavioural features do not by default include the day of the event itself.
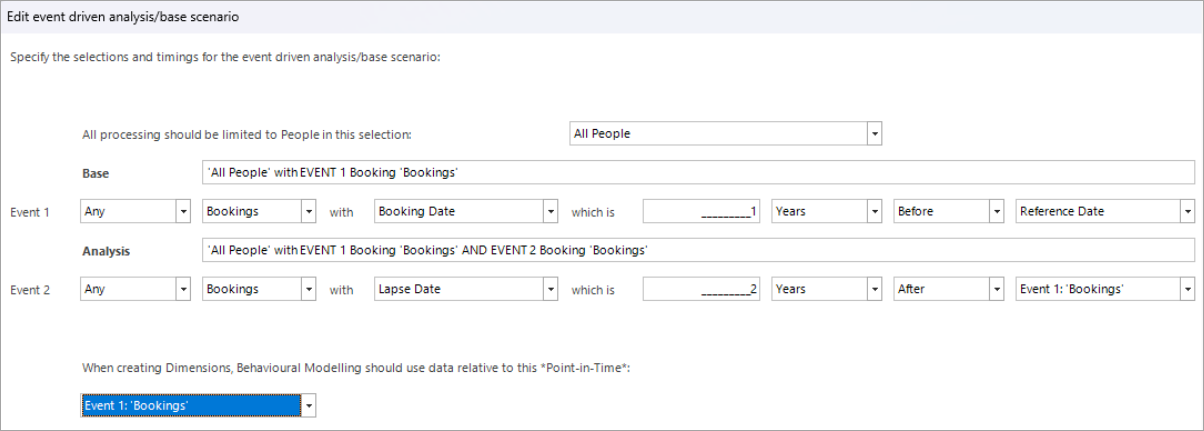
In the above example, a 'count of previous bookings' would exclude the booking which occurred on the day of the event; the person lapsing as per the diagram below, only has one prior booking, whilst the base person has two.
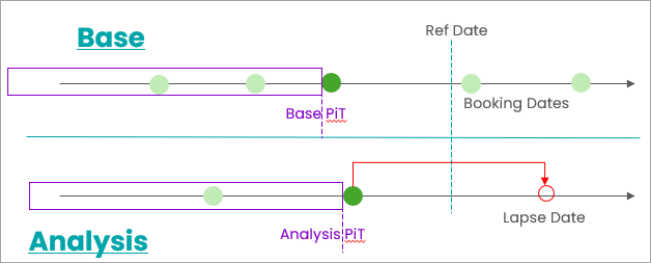
This is not an issue on data with a high volume of transactions but, for a charity system where many people lapse after a single donation, it has a significant impact.
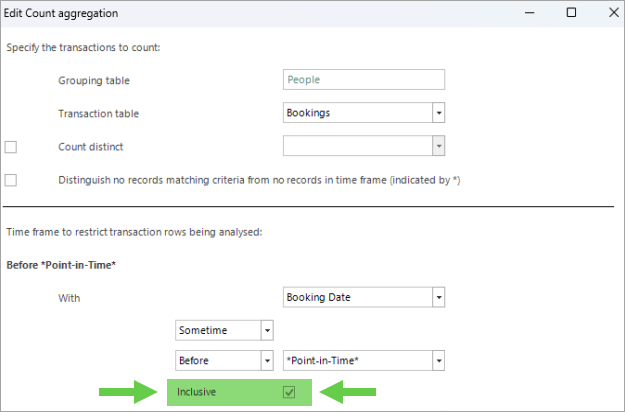
When a behavioural feature is defined, the Q1 2026 release introduces the option to include the point-in-time. This option only displays when the time frame is adjacent to the point-in-time so, for example, it is not relevant if the time frame is "3 to 6 months ago".
Transactional preview
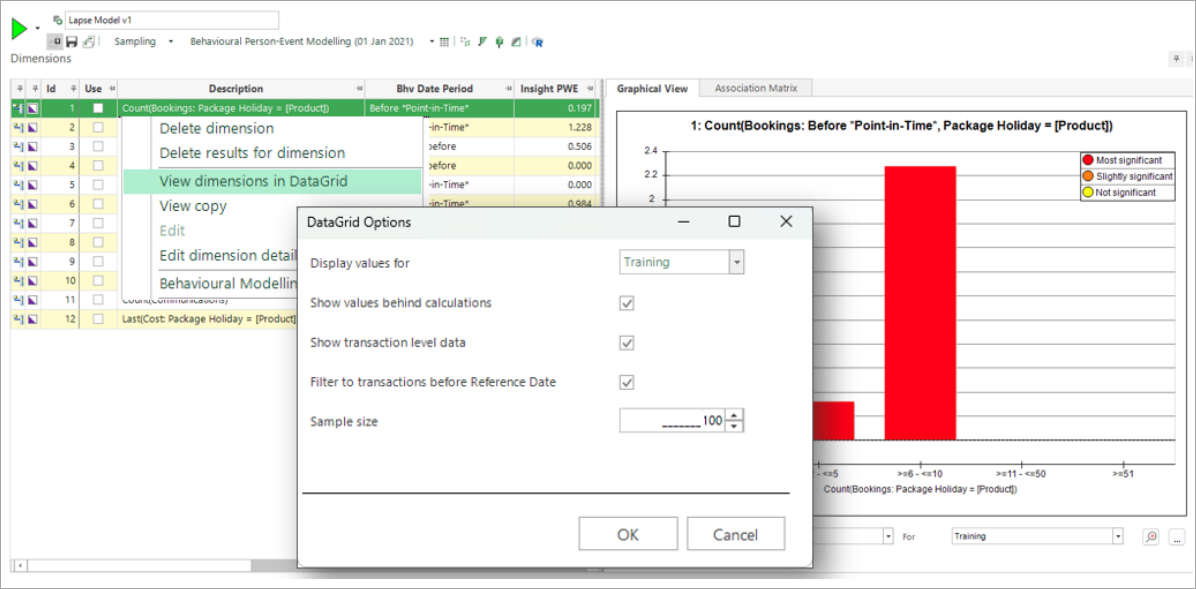
The Modelling Environment has always included the option to create a data grid which allows you to examine records relating to the behavioural features in more detail. In the Q1 2026 release, this option is extended to allow the automatic inclusion of transactional data, and to choose a sample size.
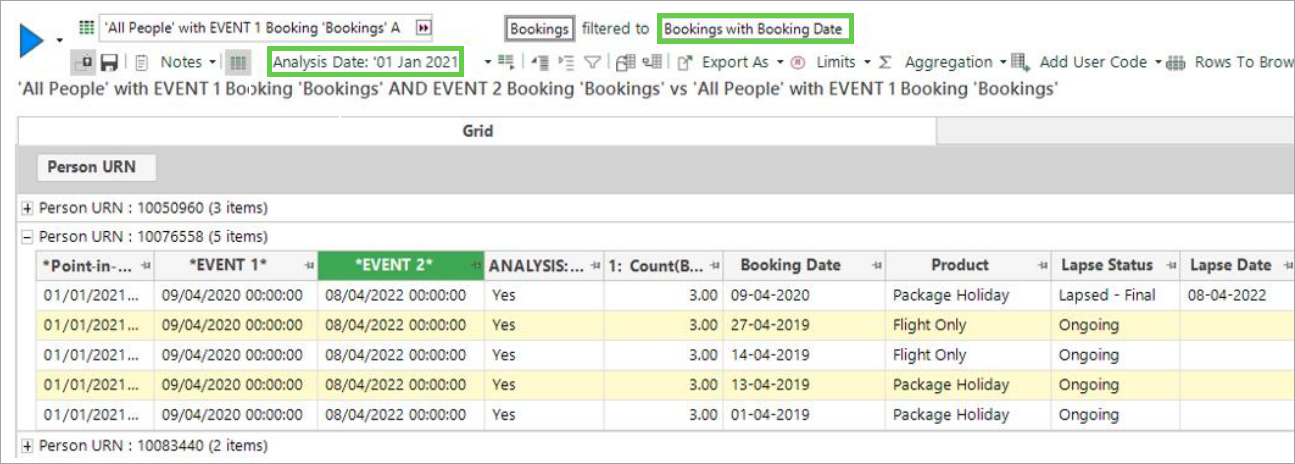
A data grid launches at the transactional level and has the analysis date set to the training date used in the model. The addition of a transactional filter restricts the bookings shown to just those before this date. Note that it is possible for there to be relevant transactions after this date "“ in which case you can adjust the filter manually.
More flexible fixed-date behavioural models
The range of selections that you can use in fixed-date behavioural models is now consistent with those possible when using events. For example, the scenario below is equivalent to the event-driven example described previously, where the reference date is used to specify both the events and the point-in-time.
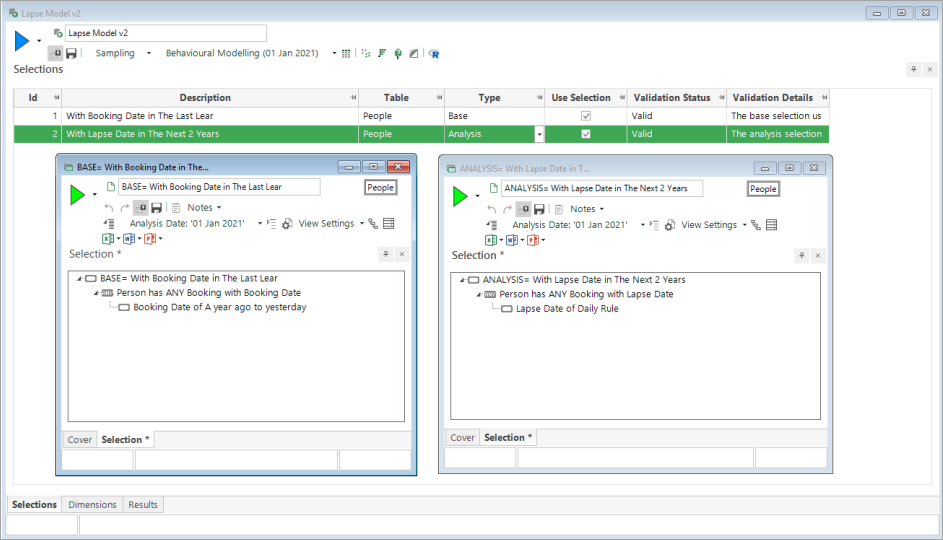
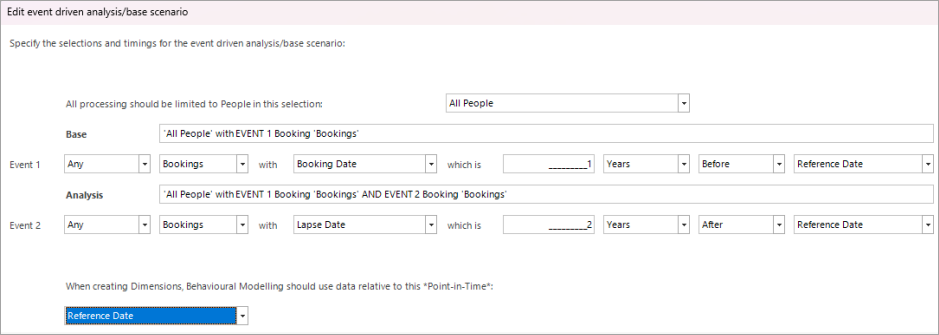
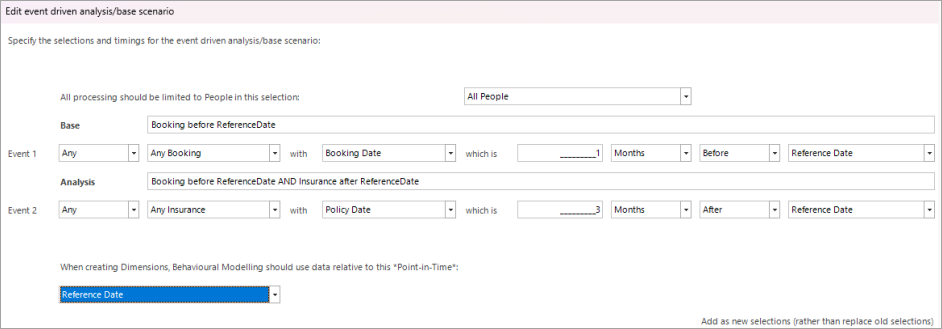
Similarly, a scenario using the analysis and base selections from different tables can be represented, as below:

This is equivalent to:
Q2 2023
The Q2 2023 release brings the following new features to FastStats Behavioural Modelling:
-
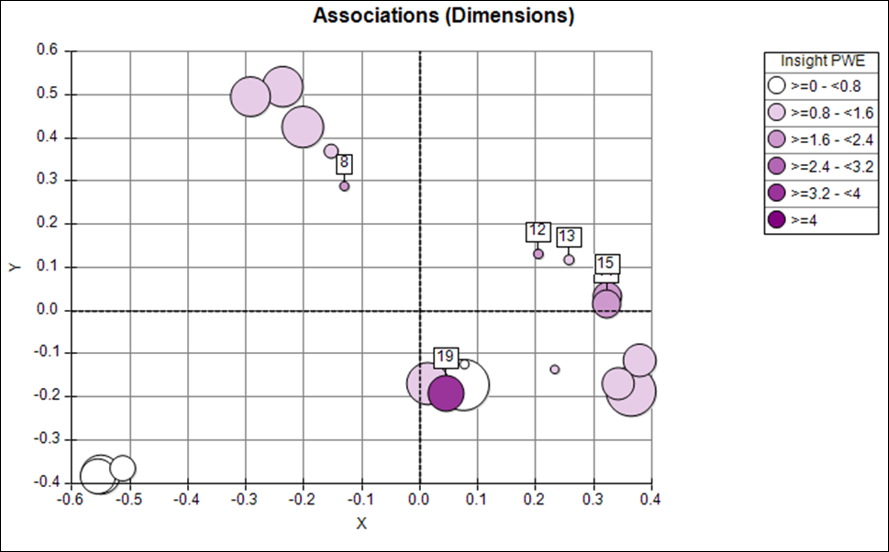
Bubble charts - to graphically display both Insight PWE and Insight Coverage
-
Incremental Insight - a single metric that allows you to choose dimensions which are both predictive and diverse
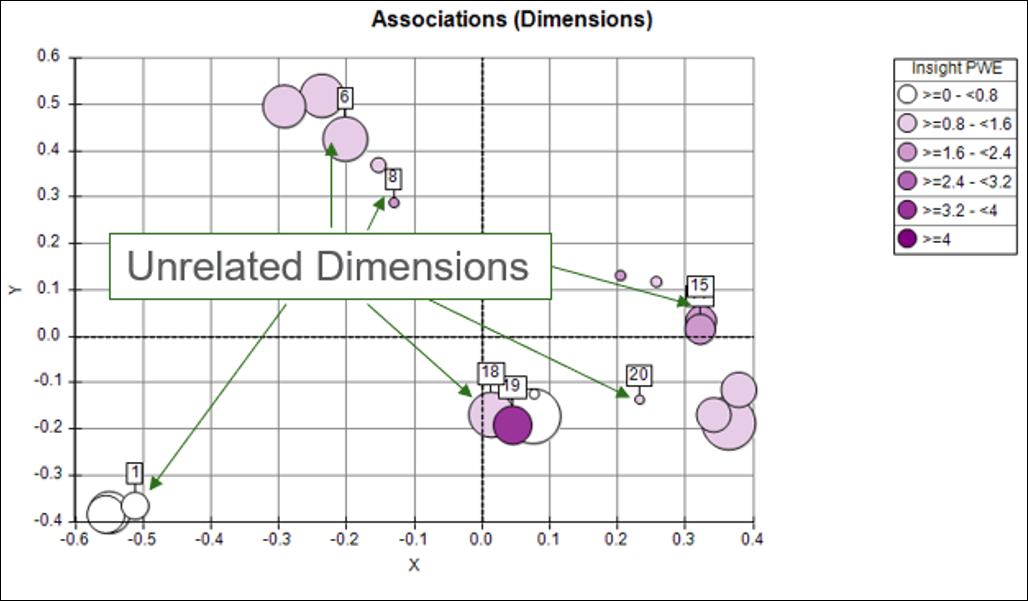
See the Incremental Insight topic for full details.
Q1 2023
The selection of behavioural features has the greatest impact upon the final quality of a data model. Whilst recent development has introduced charts and metrics which help you to assess existing features in order to identify subsets which might be predictive or diverse, the main focus of the Q1 2023 development is to make it easier to generate alternative behavioural features (dimensions).
Updates include:
-
The ability to generate new behavioural features using one or more existing features as a template. Each new feature mirrors an existing feature, adding one additional criterion.
See Generating multiple Behavioural Features with different Criteria
See below for more information on the following developments:
- More flexible control of building dimensions
- Simpler user workflow with the "Use" status
- The ability to thematically colour multi-dimension charts by Insight PWE
- Updates to the right-click menu options
- Edit Details option available in standard modelling
- Chart and Build options are saved with the Modelling Environment
A further significant development is:
-
The ability to use a FastStats Cube to carry out additional and powerful analysis on the events within a complex customer journey selection
More flexible control of building dimensions
The Build control on the Dimensions tab gives greater flexibility and visibility of what is run.
It is possible to include or exclude specific types of dimensions, and then to specify which results to build. By default, results will not rebuild if they already exist for a dimension. However, this can be overridden.
Note
For standard modelling, only Profile and Associations type results are offered.
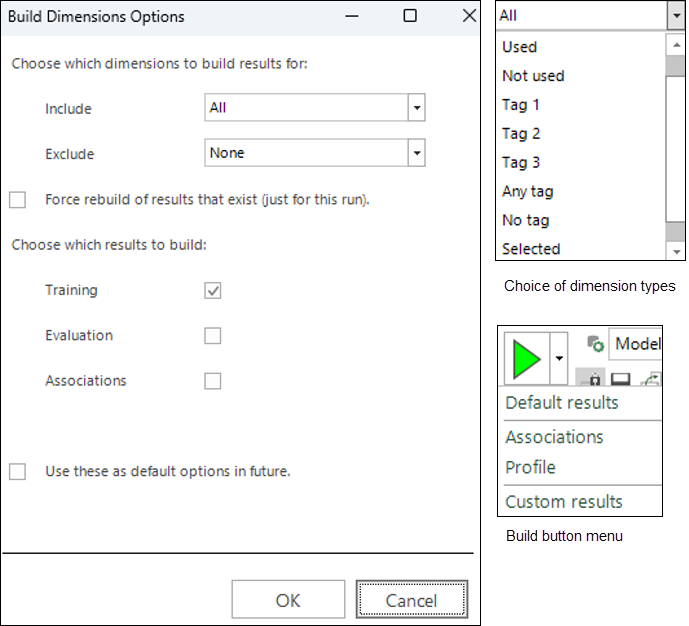
This set of choices is presented each time the Build button is clicked, until you check the "Use these as..." box at the bottom of the dialog. For example, you could set up your preferred way of building so that it only includes selected dimensions, and then choose to always build both training and evaluation profiles. The options you select are saved with the Modelling Environment.
Once you have checked the box to use the given options as the default, you can relaunch the Custom Results dialog using the sub option on the Build button menu (shown above).
Clicking OK will present a confirmation dialog of what needs to be run:
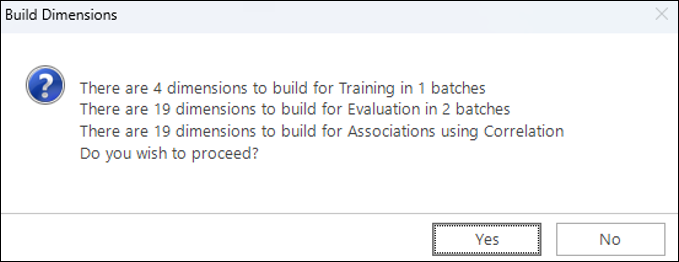
Click OK here to start the build.
As results are returned, an icon against each dimension indicates which profile results are available. There is no icon for Association results - instead view the Association Matrix to see which results have been calculated.

Once the build has started, clicking the  cancel button will stop the whole build package:

Simpler user workflow with the "use" status
Your workflow is now simpler in terms of how the "Use" status flag operates.
In previous releases, dimensions were only built when the "Use" flag was checked, but this is no longer the case. As explained under the More flexible control of building dimensions section above, you can choose which dimensions to build in several ways. Now the purpose of the "Use" flag is only to determine which dimensions to take forward when launching a model.
The workflow is:
- Create some initial dimensions - which are added to the list without the "Use" flag being ticked.
- Modify these, or generate alternative dimensions "“ again added without the "Use" flag.
- Assess dimensions using charts and metrics "“ mark subsets of dimensions with "Tags".
- Choose a subset of predictive and diverse dimensions - mark these with the "Use" flag.
- Launch a Profile or Decision Tree which will take the dimensions marked as "Use".
This serves to simplify the choices that you need to make, as dimensions are created using the behavioural modelling menus.
For example, in the case where you select one dimension and generate five features - let's say, one for each continent; if one of the generated features already existed in the list, the following dialog would be displayed:
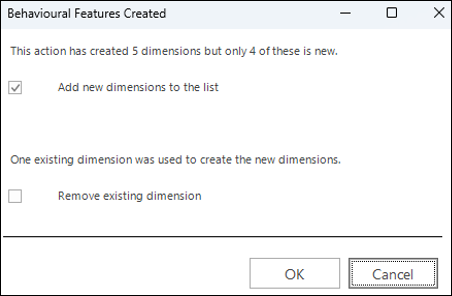
You have the choice to:
- Proceed and add the four new dimensions
- Remove the selected dimension
- Cancel and do neither
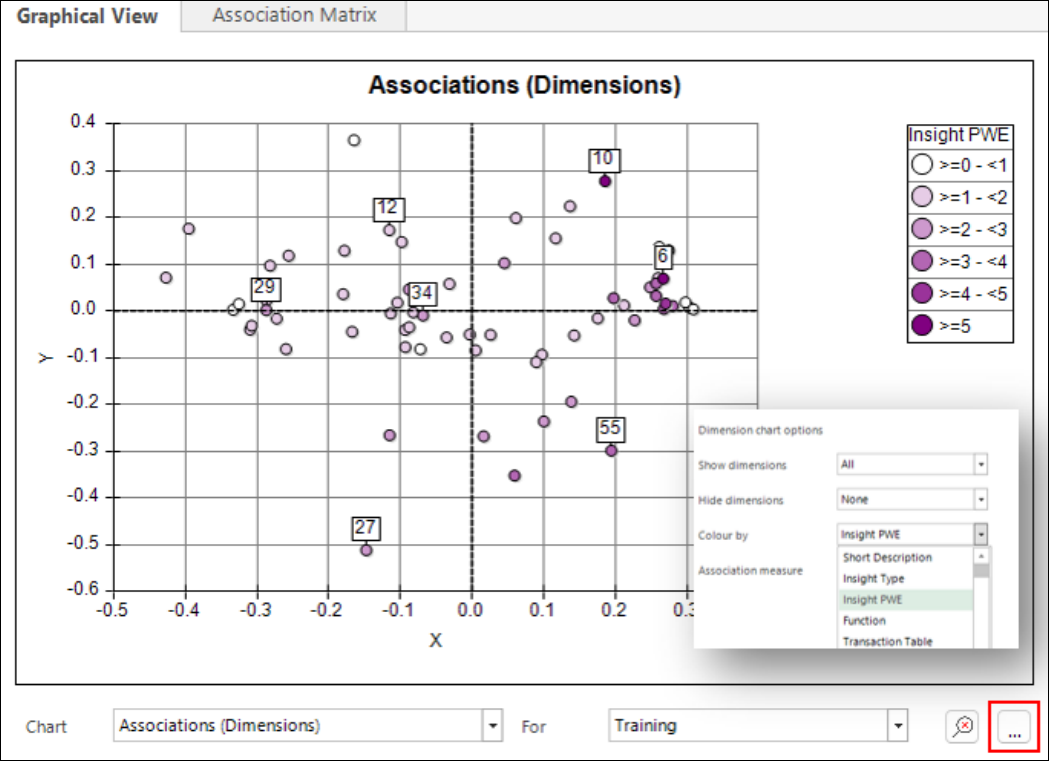
Colour by Insight PWE
Charts which show multiple dimensions can now be coloured thematically based on the Insight PWE value. By using the Associations chart and selecting a range of dark points which are spread out, it is possible to choose a subset of both predictive and diverse features in one go.
Right-click menu options
There have been some small changes to the right-click menu which is available when clicking on a dimension, as shown below:
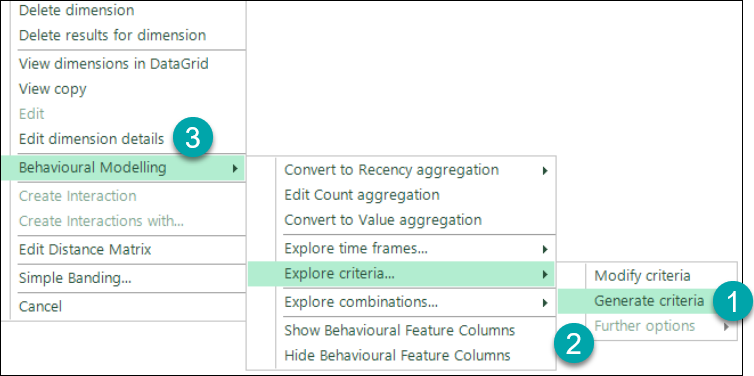
- The Generate criteria option now sits outside of the Further options section.
- You can only access Further options when clicking on a dimension with existing criteria. It allows you to generate a relative to total feature, or to combine the criteria from multiple dimensions.
- The Edit dimension details option is now also available in standard modelling, and for simple variable dimensions; previously, it was on the Behavioural Modelling sub-menu. See Standard modelling update - Q1 2023 for more information.
Saving chart and build options
Any options you select for configuring a chart display are now saved with Modelling Environment. As mentioned above, this is also the case for your chosen build options.
Q4 2022
This release extends the functionality for visualising and identifying a diverse set of predictive features for use in a data model. This includes:
-
Negative Niche Features - features which apply to a few customers but give a strong indication of being a poor prospect.
-
Insight and Non-insight Categories - all categories of a dimension are now described as either ‘insight categories' or non-insight categories'.
-
Insight PWE "“ to supersede "Uplift PWE"
-
Insight Coverage "“ provides an indication of the number of people for whom a dimension can give a significant and sizeable prediction.
-
Insight Type "“ all features are now assigned an insight type based on the nature of the insight they provide.
- Insight columns - you can view the above concepts and measures as columns in the dimensions panel
Note
The Insight definitions described and used for behavioural modelling are based on Training data alone. This is a change from the previous release when evaluation data was used in some parts and enables full support for insight measures and charts in standard modelling (see below).
Also added in this release:
- Further options for selecting and displaying dimensions in charts
- Where applicable, the concepts, charts and measures used for behavioural modelling are also available for standard modelling - see Standard modelling update - Q4 2022.
- Performance improvements with parallel building of dimensions - see Parallel running of dimensions.
Let's take a closer look at these developments.
Niche features: positive and negative
The idea of niche features was first introduced in the 2022 Q2 software release and refers to behavioural features which apply to only a few customers, but nonetheless provide a very strong positive indication of a good prospect. This has been extended to include negative niche features which, again, only apply to a few customers, but give a strong indication of a poor prospect.
For example, "Number of months since last web donation" might only apply to the niche 10% of supporters who have ever made a web donation but, for these people, it could highlight them as very unlikely to respond to a direct mail campaign (since they prefer online engagement).
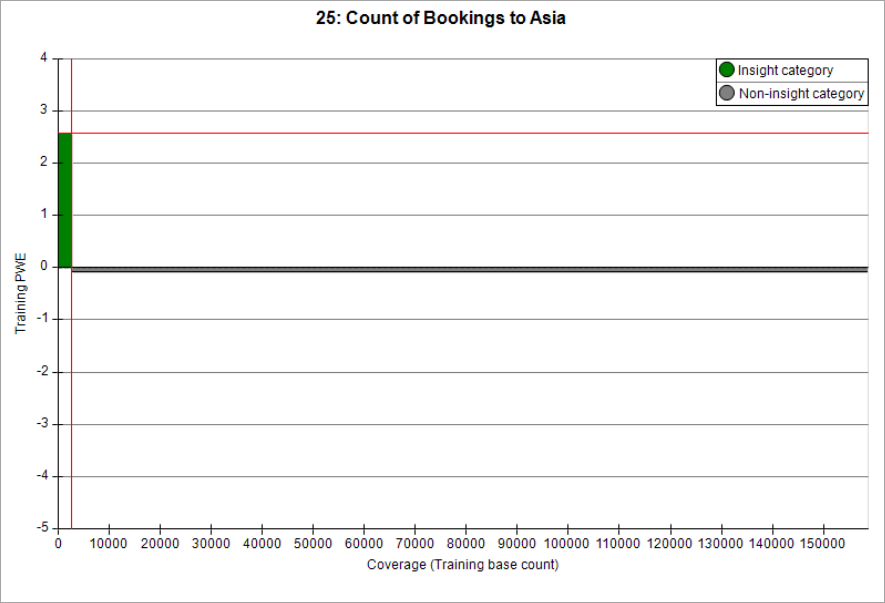
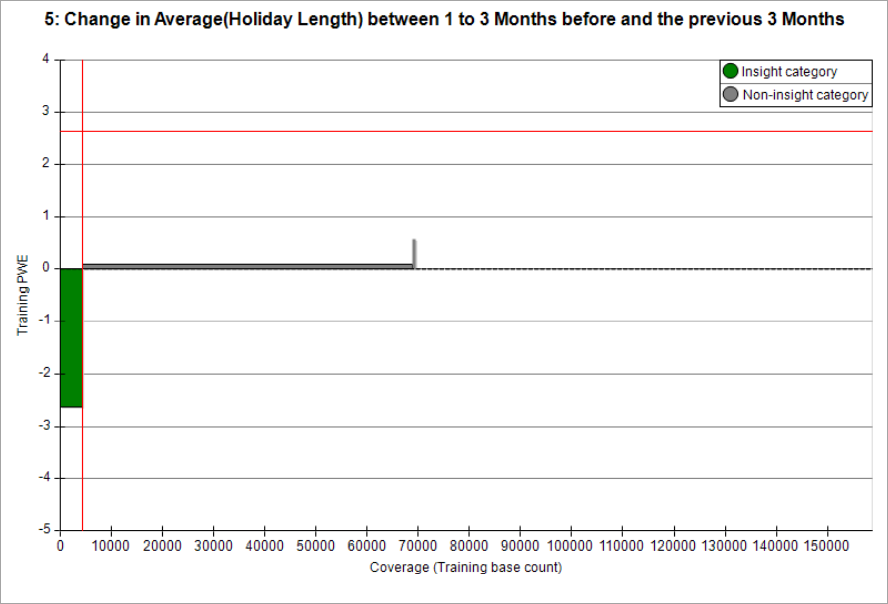
We will consider a fuller definition for this in the "Insight Type" section below.
Insight categories
The insight categories of a dimension are those which enable a significant and sizeable prediction to be made about a person's behaviour. A category is deemed "non-insight" if the Z-score is non-significant with an absolute value below 3.0, or the PWE score is too small with an absolute value below 0.1.
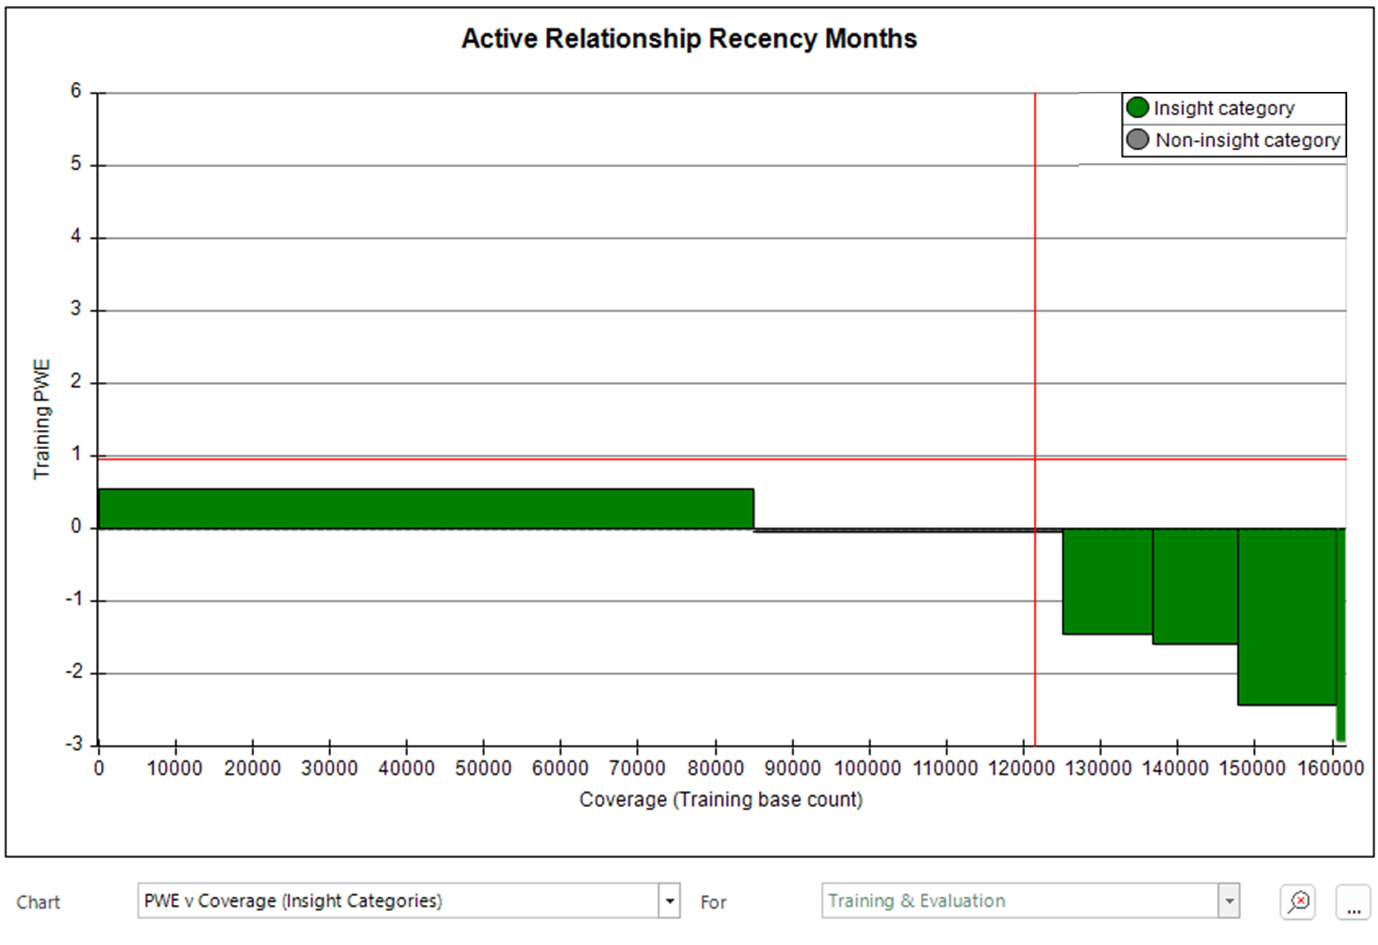
The chart above shows the PWE value from each category, where the width of the bar indicates the number of people in this category.
- The bars are ordered from left to right according to PWE.
- The category to the right of centre has a PWE value that is very close to 0 and would be classified as a non-insight category.
Note
All categories of a dimension are now described as either "insight categories" or "non-insight categories".
Note
The vertical and horizontal cross hairs represent the Insight PWE and Insight Coverage measures which are described in the next sections.
Insight PWE
Insight PWE supersedes Uplift PWE (which only included positive PWE values) and provides a measure of the predictive strength of a dimension over those categories where a sizeable and significant prediction can be made (the ‘insight categories'). Insight PWE is the mean absolute PWE over just these categories, weighted by the number of people in each category.
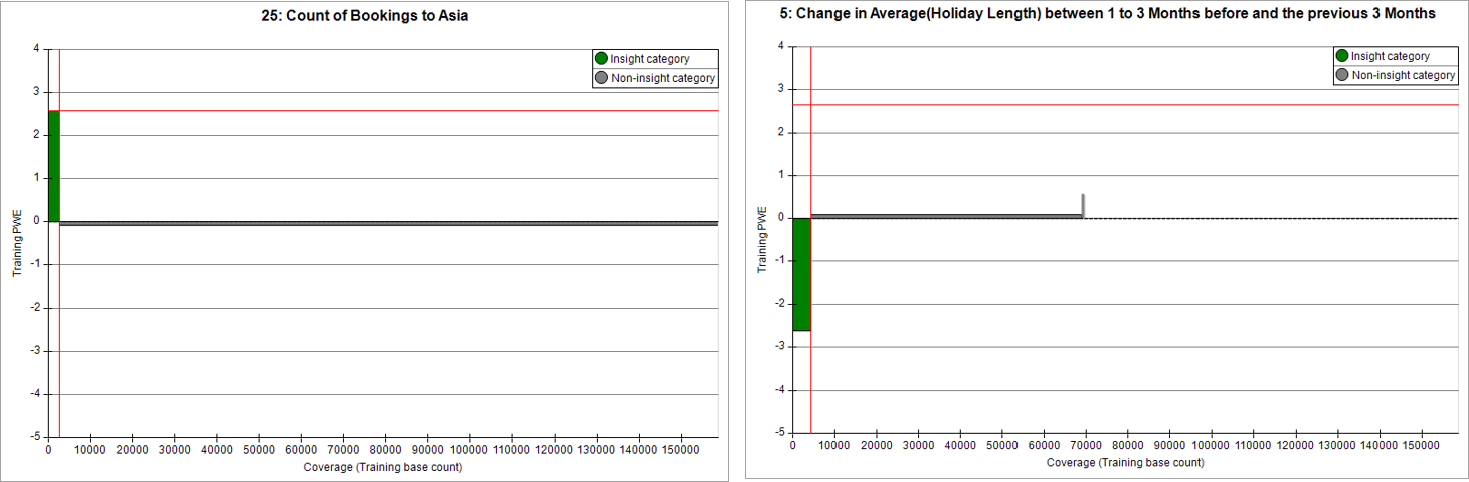
The horizontal crosshair indicates the level of insight PWE for a feature. Here, where insight is predominantly positive or negative, this clearly fits to the size of the insight categories. This is less clear in the previous PWE v Coverage (Insight Categories) chart; this displays balanced insight since it is an average of both positive and negative values.
The traditional metric of “Mean PWE” takes into account all categories and, as a result, is dramatically reduced in the case of the niche features shown above; the mean would be reduced by the near-zero value that is scored by the majority of people. Consequently, niche features cannot be identified by just using their Mean PWE metric.
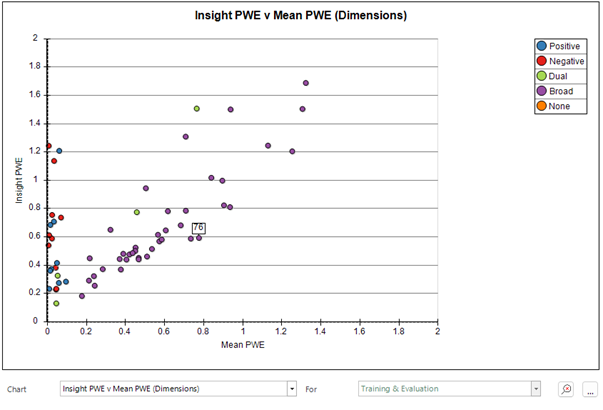
Note
The concept "Insight PWE" supersedes the term "Uplift PWE" which only included positive PWE values. Insight PWE also includes sizeable negative values.
Insight coverage
Insight coverage gives an indication of the number of people for whom the dimension is able to give a significant and sizeable prediction. It can be expressed as a simple count, or as a percentage of the total number of people in the Base selection.
The insight coverage can vary dramatically between dimensions when behavioural features are based on different transactional tables. For example, in the Holidays demo database, where only 40% of people have ever taken out insurance, any behavioural feature based on insurance data will never be able to make a prediction about the other 60% of people.
The vertical crosshair on the chart below shows the level of insight coverage. Since the feature is based on the date of someone's last insurance policy, the majority of people are not scored by this feature. Hence the coverage is only about 10%
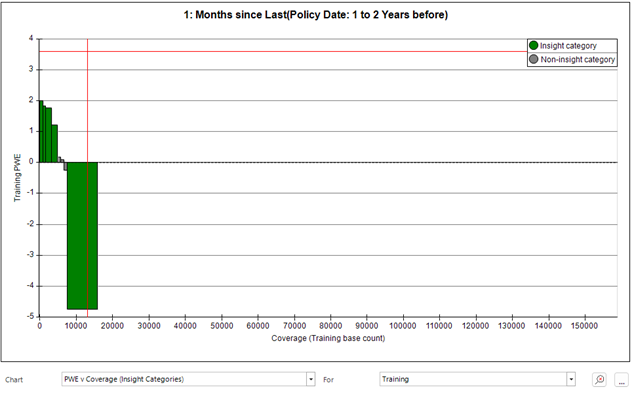
Note
The feature above includes some non-insight categories with PWE values around zero. The width of these bars accounts for the offset in the position of the vertical crosshair, since they are not included in the Insight Coverage measure.
Insight type
All features are now assigned an Insight Type based on the nature of the insight which they provide:
- Positive features - where the insight categories predominantly have a positive PWE
- Negative features - where the insight categories predominantly have a negaitive PWE
- Balanced features - where the insight categories provide a balance of positive and negative insight
- No insight - where there are no categories with a significant or sizeable PWE
The definitions use an 80:20 cut-off to categorise dimensions and, if the balance of positive/negative insight categories is less extreme than 80:20 based on coverage, the feature is classed as balanced.
A range of features from customer data is plotted below.
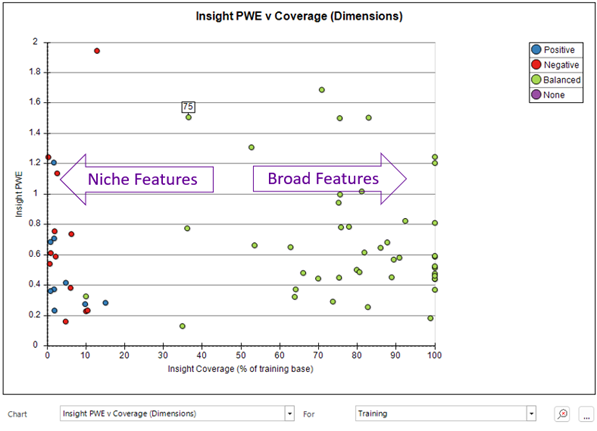
The terms "niche" and "broad" aren't given a formal definition or cut-off, but are based on a spectrum of insight coverage values, helpful to get a sense of how many people could be given a model score by each dimension.
Notice that the positive and negative features all have relatively low coverage and are generally niche features. This is not based on any formal definition, but is a consequence of the mathematics involved in calculating the PWE values. Where there is a category of a dimension which groups the majority of people together into a category such as "no previous transaction", this category then dictates what the "average person looks like" and, so, people in this category have a very small PWE value (since the PWE value is a measure of the difference from average).
Insight columns
You can view the concepts and measures described above as columns within the Dimensions panel.
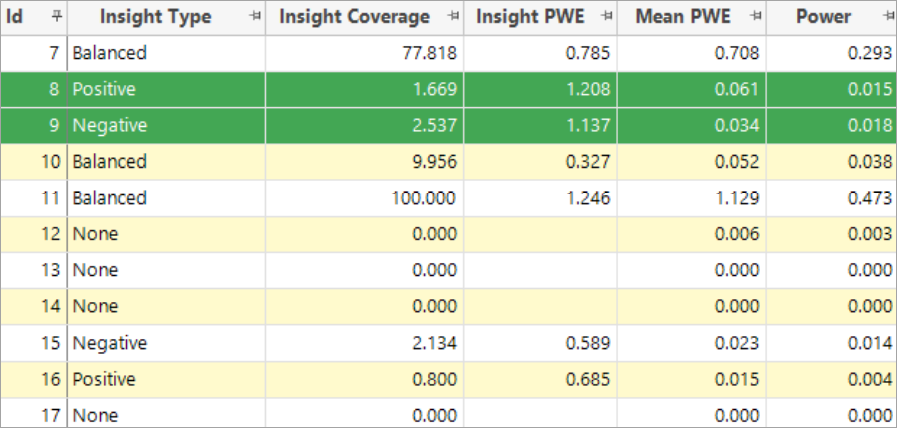
Notice the big difference between Insight PWE and Mean PWE for the highlighted positive and negative niche features. These have a very low insight coverage - they can only give insight on 1% or 2% of people, but for these people there is strong insight.
Also added in Q4 2022:
Further chart options
The chart options dialog (launched with the "…" button) offers more flexibility for the appearance of charts:
- Option to hide as well as show dimensions
- You can control dimension visibility in terms of tags, selected and used status
-
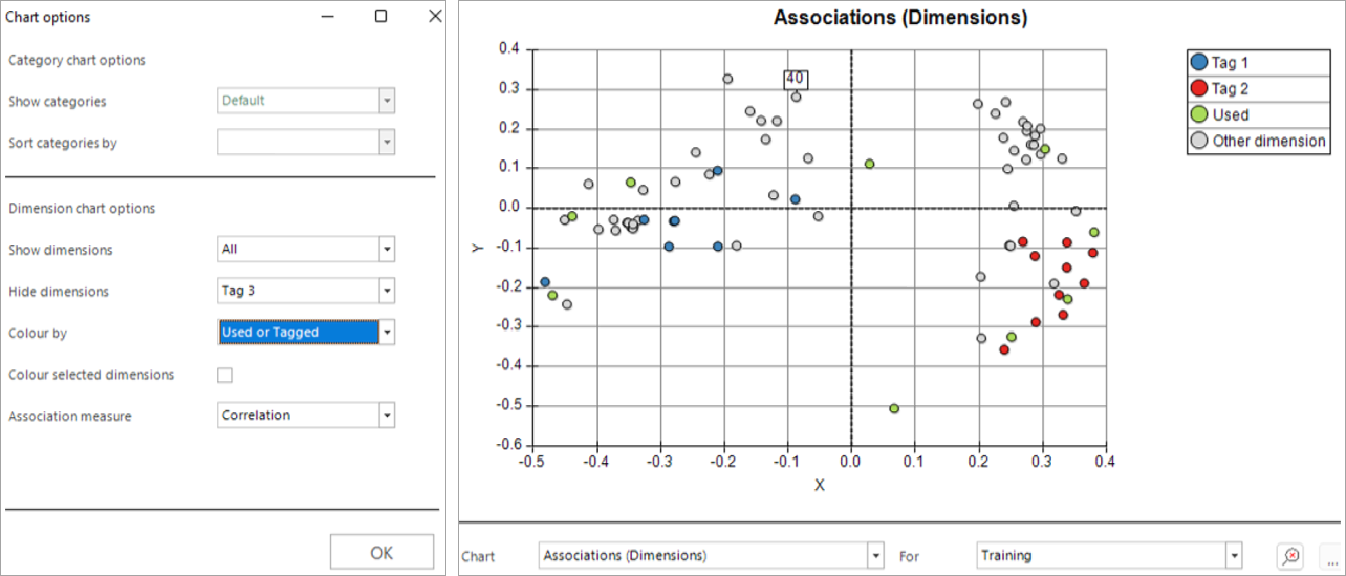
You have more options for how points are coloured, including Insight Type
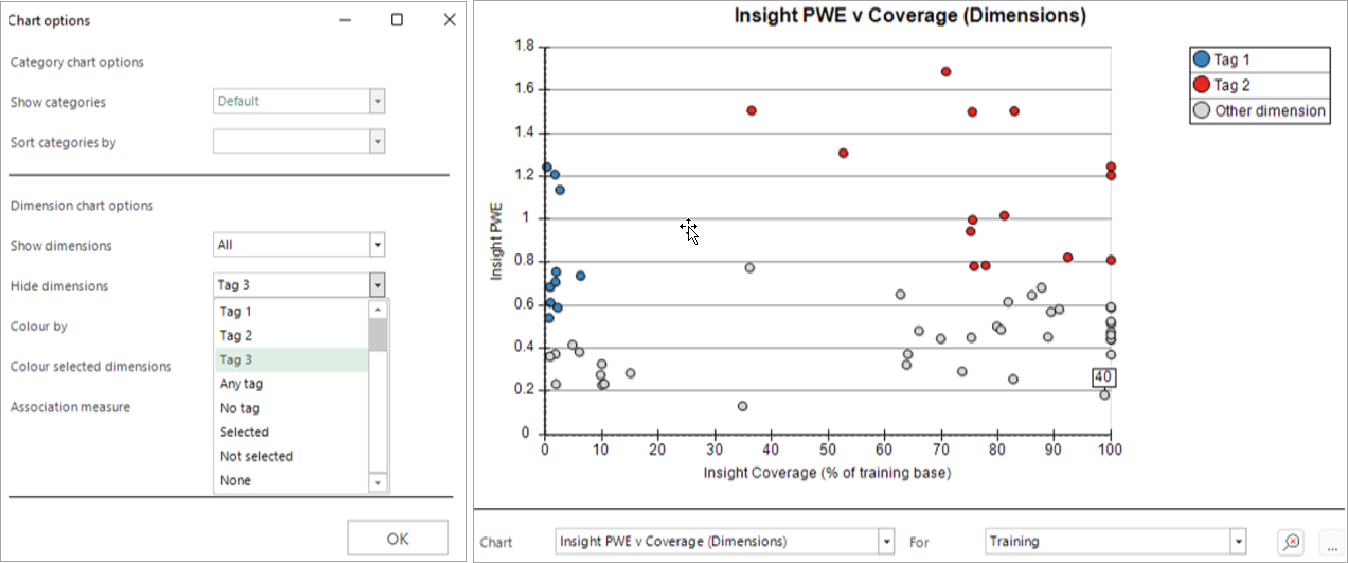
One useful work flow would be to use the above chart to select points (using a shift-click action to define a rectangle) and then tag the best niche and broad features (as above), before using the Associations chart to select a range of diverse features and mark these as used.
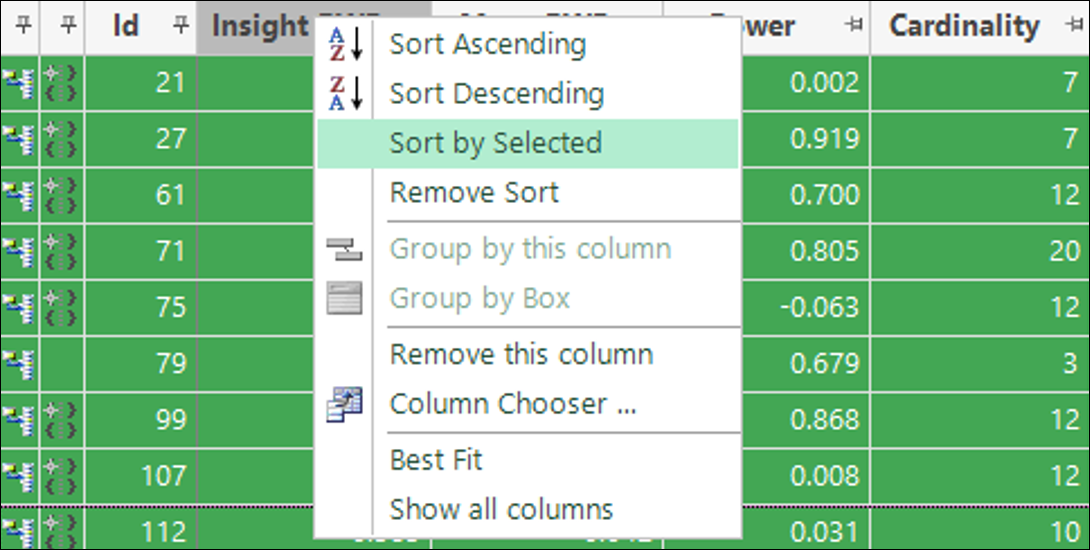
Sort list by selected columns
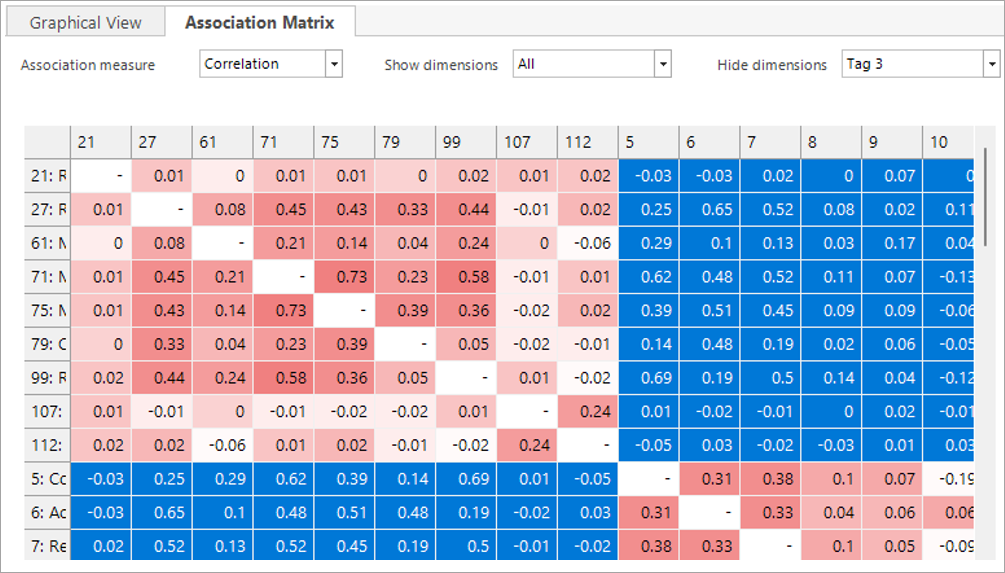
You can sort dimensions based on whether they are selected. This can be helpful for aligning the cells in the Association Matrix, which automatically follows the same sort order.
Association matrix options
The Association Matrix supports the same show/hide controls as the dimension charts.
Note
Choices are synchronised between the two places where the controls are displayed.
Note
Insight definitions use Training data alone
The Insight definitions described in this document and used in Behavioural Modelling are now all based on training data alone, in order to support use in Standard Modelling where there is no concept of "Evaluation". In the previous release, evaluation data was used in some parts.