Viewing the map
The screenshot below shows the Plot Map created here.
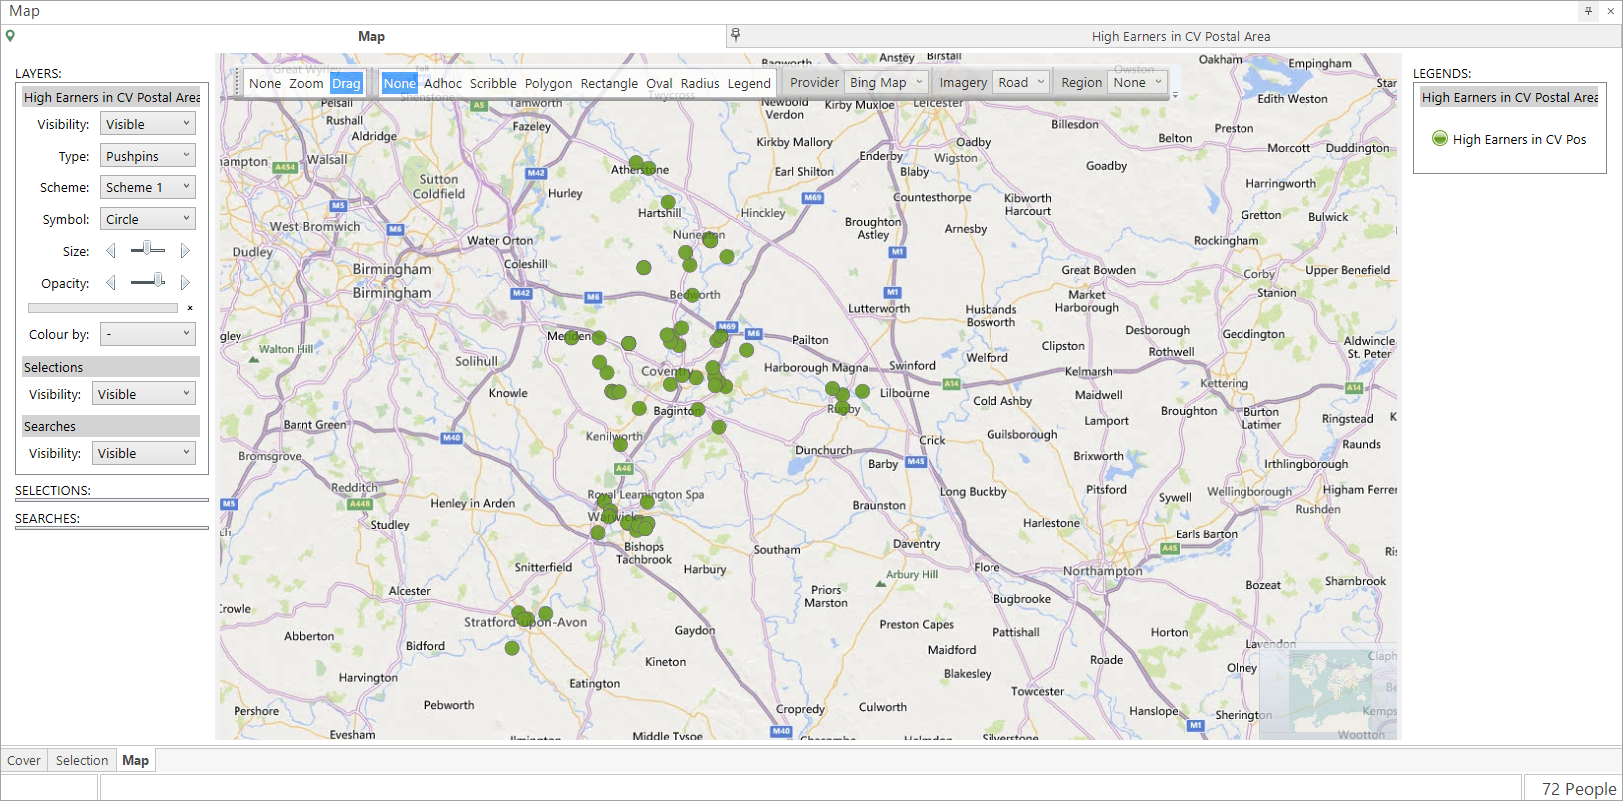
Now that the results have been calculated and displayed, we can see the map has zoomed in over the Coventry Postal Area with pushpins representing all postcodes captured as part of the underlying selection.
Layer settings
Options for this layer can be set in the Layers panel:
.png)
| Setting | Description |
|---|---|
| Visibility | Makes the layer display visible or hidden on the map. |
| Type | Select the type of pushpin to display. |
| Scheme | Select a colour scheme to be applied to the shading and the type and number of ranges to use. |
| Symbol | Select the type of symbol to represent the pushpin. |
| Size | This control allows the pushpins to be increased or decreased in size. |
| Opacity | This allows control over how visible the layer is over the map. Moving the slider to the right makes the layer colours more solid until the map is no longer visible. Moving the slider to the left makes the layer colours more translucent until only the underlying map is visible. |
| Colour by | This will colour code the pushpins by an additional variable selected from the list. |
For information on how to view results - see Viewing the results