Statistical significance report
This report does a statistical test to see whether any differences in response rate are significant, given the size of the samples used. The (±) column shows how different the response rate could have been on another occasion with a similar sized run. For example, a response rate of 30% ± 20% could be anywhere between 10% and 50%. The Z-Score for a given row shows whether this row's result is significant — a value less than 1.96 is not significant, meaning that a different run could well yield the opposite result when compared against the control.
Note
The report is only given as an option where a Response step exists.
Viewing the report
- Navigate to a Message step which includes a Response step.
-
Select the Statistical Significance Report from the Results view.

-
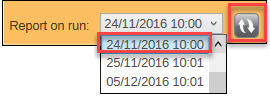
Refresh the Report on run list and pick a run from the drop-down.
-
Click Generate.
Example Statistical Significance Report broken down by Brochure:
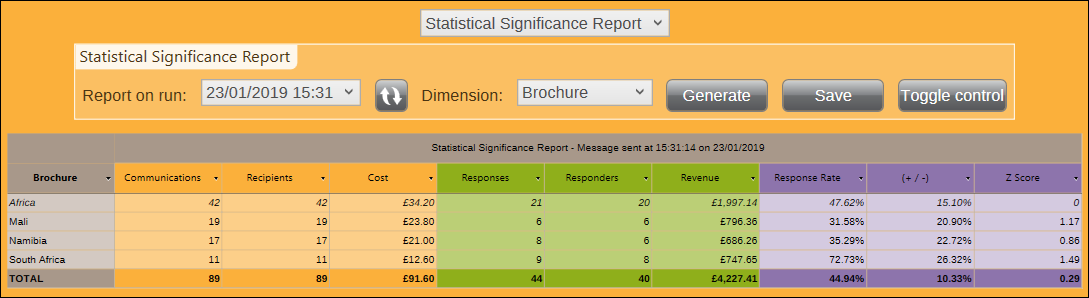
The (±) column shows how different the response rate could have been on another occasion with a similar sized run. E.g. a response rate of 30% ± 20% could be anywhere between 10% and 50%. The Z-Score for a given row shows whether this row’s result is significant – a value less than 1.96 is not significant, meaning that a different run could well yield the opposite result when compared against the control.
Z-Scores confidence table
| Z-Score | Confidence |
|---|---|
| > ± 3.29 | > 99.9% |
| > ± 2.576 | > 99% |
| > ± 1.96 | > 95% |
| > ± 1.65 | > 90% |
| <= ± 1.65 | <= 90% |