Migration (2 points)
Having created and added your segment selections, and defined your Fixed Time Reporting Points, you can run the Migration (2 points) report to view the volume or volume/value migration of customers between segments within 2 specific points - for example 01/01/2019 and 01/01/2020.
- Click on the Migration (2 points) tab.
- Enter the From date as 01/01/2019 and the To date as 01/01/2020.
- Click Build to generate the report.
Volume migrations
All
This default view provides the most detail about the migrations which have occurred between 2 points:
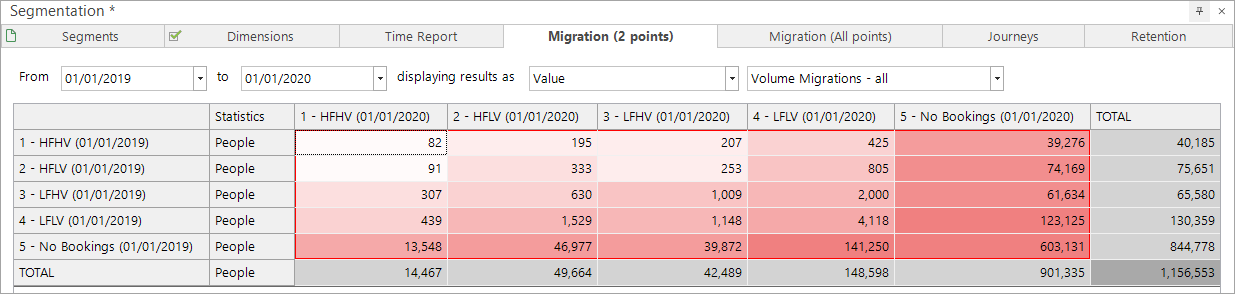
In the above example, we can see that of the 40,185 people in HFHV on 01/01/2019, by 01/01/2020:
- 82 are still in HFHV
- 195 are now in HFLV, 207 are now in LFHV
- 425 in LFLV and
- 39,276 made no bookings at all
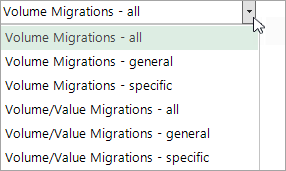
A number of options are available to select from in the drop-down menu:
General
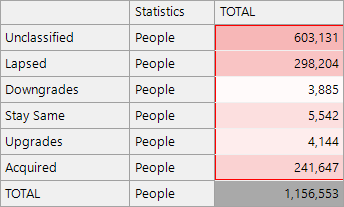
This provides a summary view that defines the general direction of movements between segments. For example, the Lapsed group tells you the number of people who were in a segment but who are not now a customer. Conversely, the Acquired group shows those who were previously not a customer, but now fall into a customer segment.
Specific
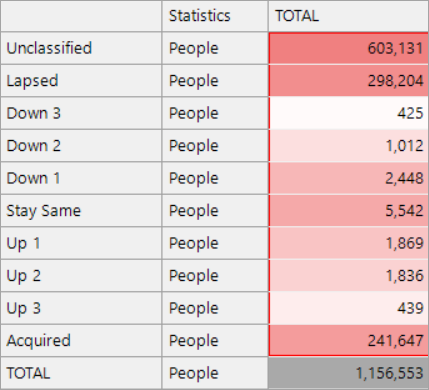
Because the segment selections are hierarchically prioritised, movement can also be split to show the direction and extent to which a person has moved up or down through segments, or that they started and ended in the same segment:
Note
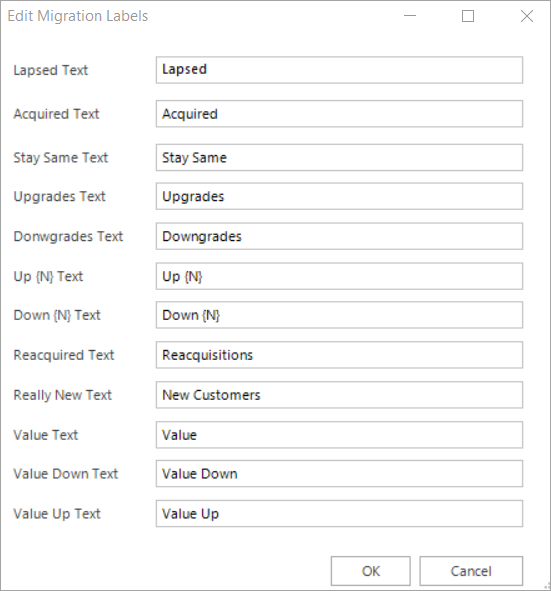
The labels that describe the migrations can be edited to reflect the language that you and your colleagues prefer to use - for example, Churned / Lapsed.
To amend the default label descriptions:
-
Go to the Segment Settings tab on the Segmentation toolbar and select Edit Migration Labels.
In addition to movements in terms of the volumes of people, you can ascribe value metrics to your segmentation migrations. For example, the report indicates that 82 people have remained in the top HFHV segment between 01/01/2019 and 01/01/2020, but those people may have increased - or decreased - their value with the business.
Before you can run the volume/value reports, you must define value-based properties including a revenue variable, a date variable and a time period. This allows FastStats to calculate the required statistics and return:
- Value in the current period
- Value in the previous period
- Change in value - this defaults to 'up' or 'down' but can be set to N bands with boundaries of your choice
To set up revenue metrics:
-
Click to open the Segment Settings dialog and select Edit Value Properties.
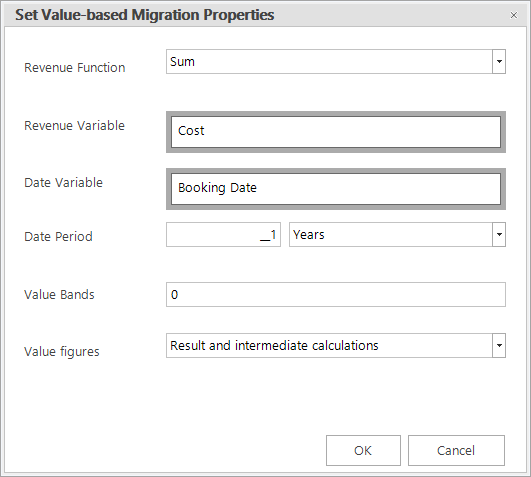
For this example, in the Set Value-based Migration Properties dialog:
- Select Sum as the Revenue Function
- Drag and drop the Cost variable as the Revenue Variable
- Drag and drop Booking Date as the Date Variable
- Leave the Date Period as the default 1 Year
- Leave Value Bands as the default 0
- For the Value Figures, select Result and intermediate calculations
Note
For the general and specific Volume/Value Migrations you can set your own value bandings - see below.
Once you have defined your settings, click OK to return to the Segmentation window and then select how you wish to display your volume/value results using the drop-down menu.
Volume/value migrations
All
The most granular report where, in this example, you can see the segment someone was in at 01/01/2019 and the segment they had moved to by 01/01/2020, together with the value contribution at an individual level - i.e. value down or up - as well as the results of the revenue figures.
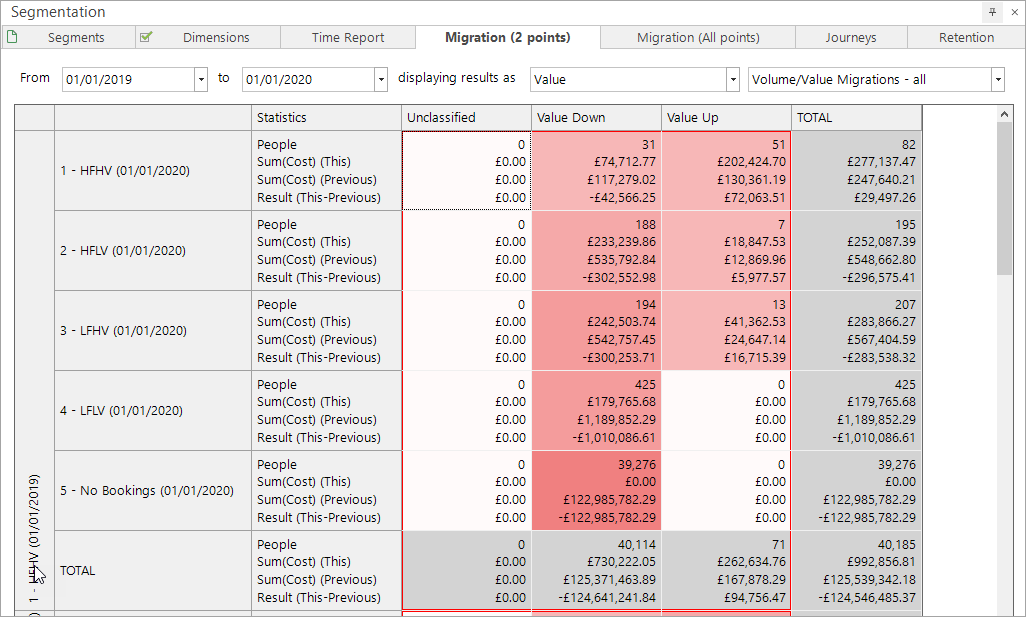
For example, here, you can see that of the 82 people who remained in segment 1-HFHV:
- For 31 of them their revenue went down, for the other 51 it went up.
- Of the 31 whose revenue went down, their value in the last year was £74,712.77 compared with £117,279.02 in the previous year - a difference of around £42.5k.
- For the other 51 people there was an increase in revenue of about £72k.
General
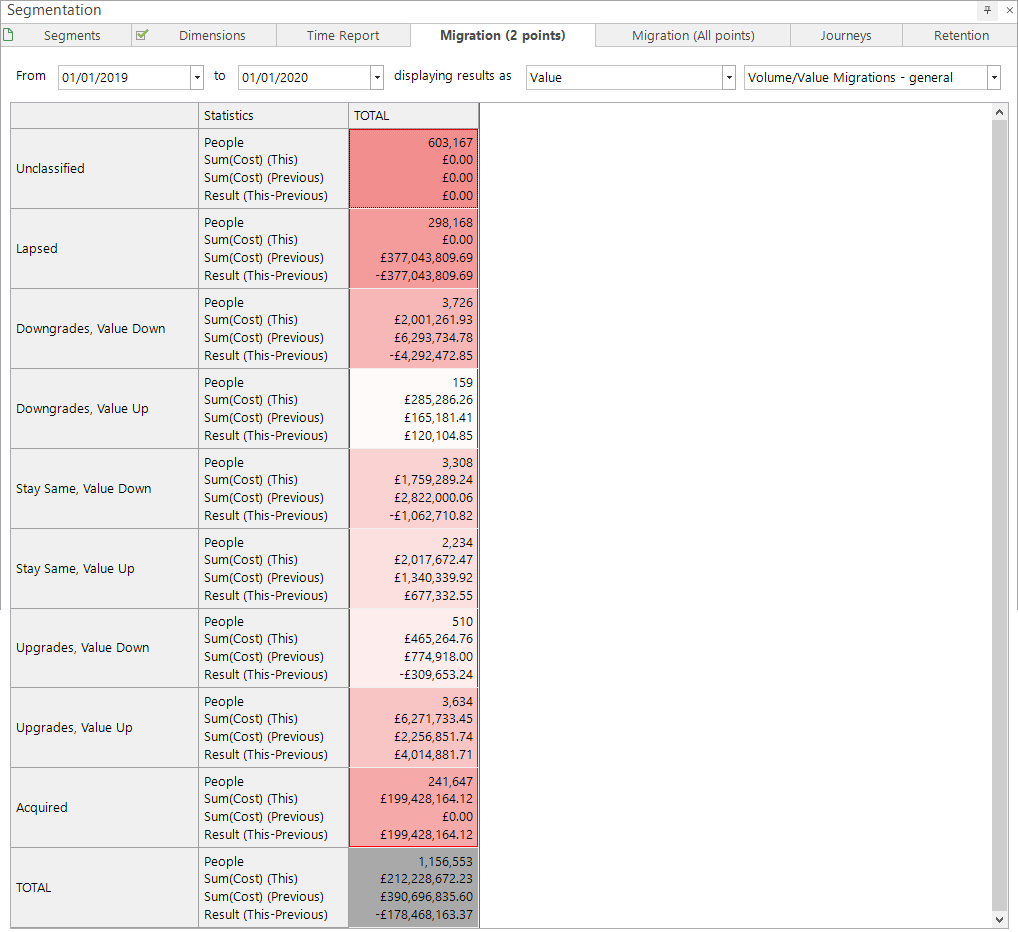
The general report shows you:
- The lapsed figures - for example, 298k people lapsed between 01/01/2019 and 01/01/2020 with a loss of £377m revenue.
- You can see movement between segments in the middle cells.
- The acquired revenue is around £199m from 241,647 new customers.
Specific
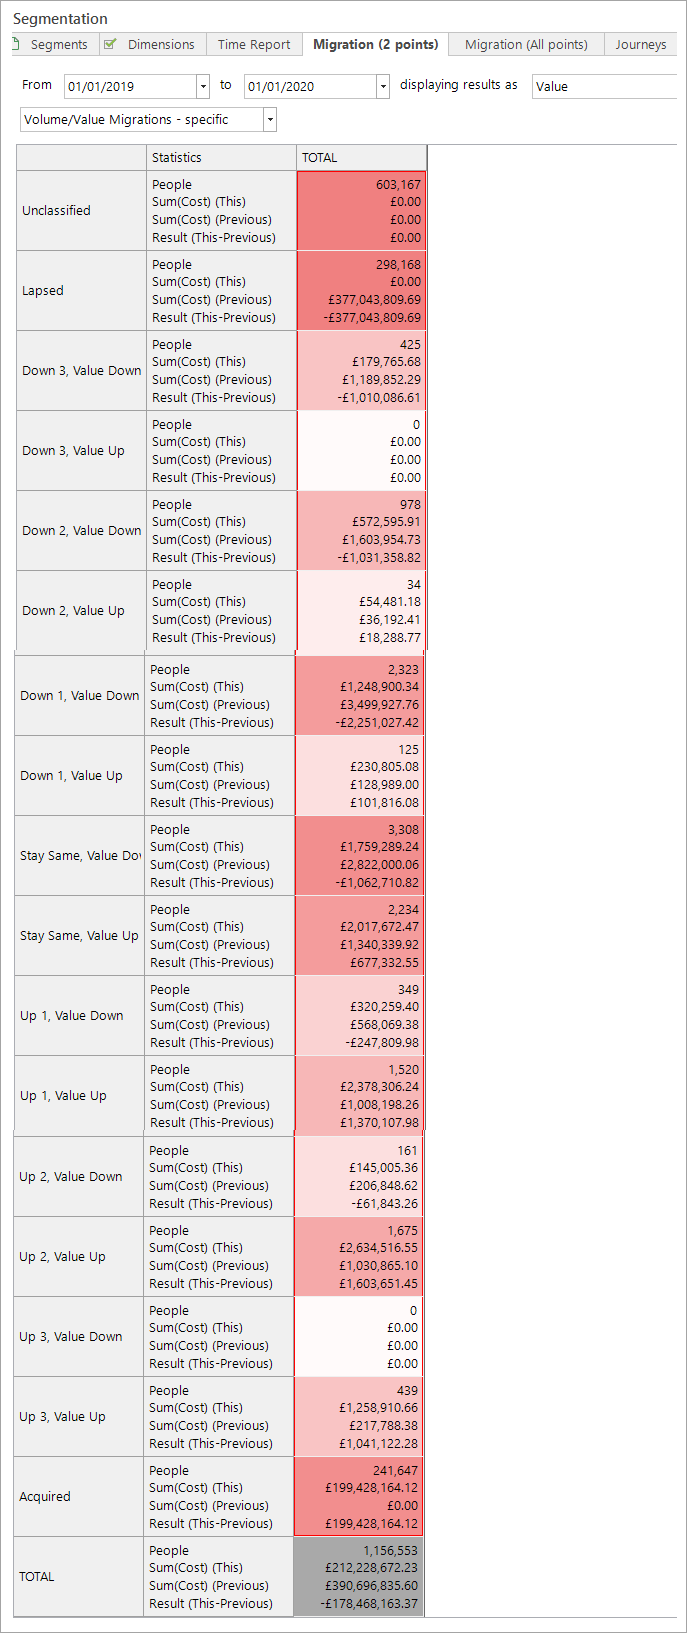
This report displays more detail about the direction of movements between segments, together with the corresponding value results.
It is possible to define specific volume bandings when creating the general and specific displays. To do this, go back to Segment Settings > Edit Value Properties and in the Set Value-based Migration Properties dialogue:
- Enter your bands into the Value Bands field - for example, -500,0,500.
-
Click OK and rebuild the display.
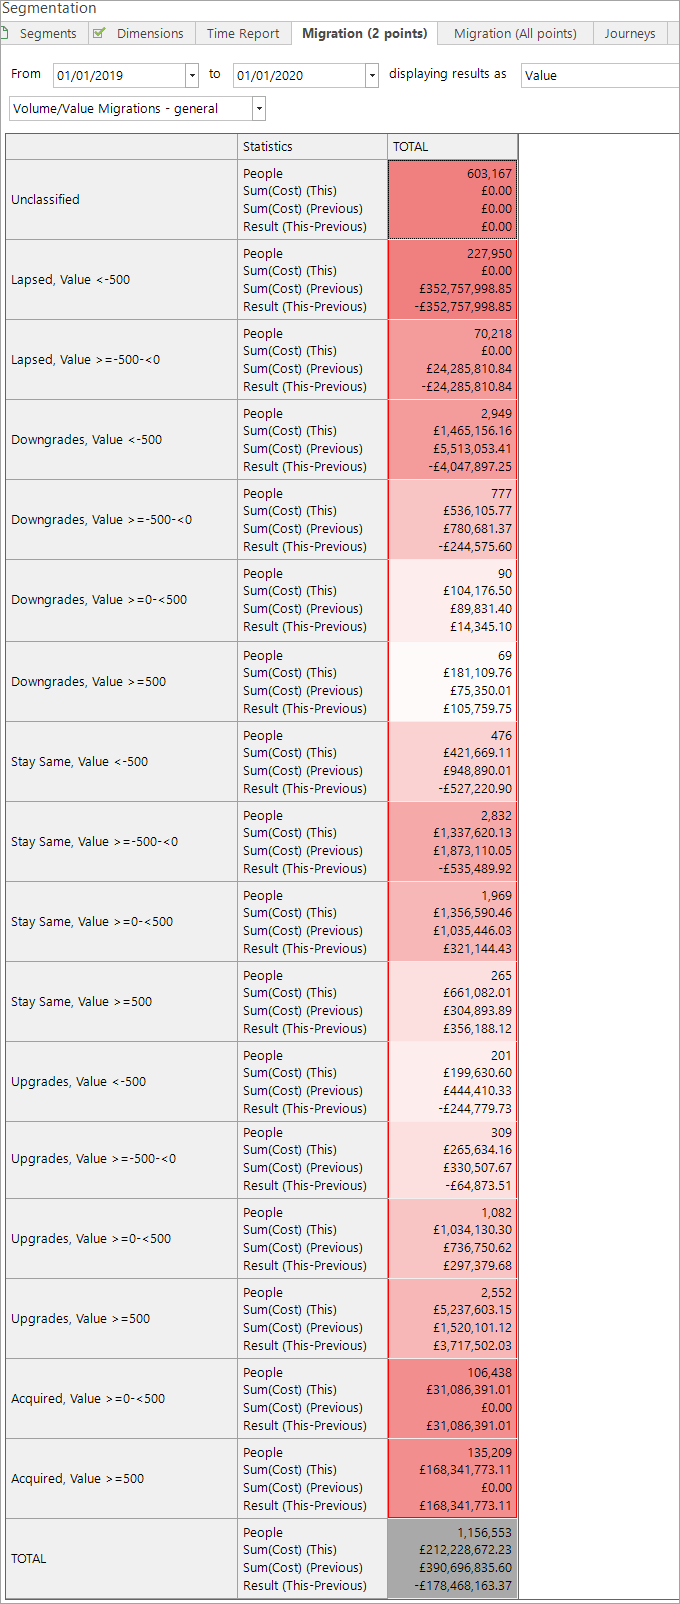
To take your analysis a step further, you may wish to see the movement between all the points that you set on the Reporting Points tab. See: Migration (All points).