Category grouping - linear trend
Whilst using rank coefficient as the output function can indicate correlations between a person's transactions, linear trend allows you to more accurately establish relative increases or decreases in value over time.
As well as being able to examine the linear trend of individual transactions, you can also group a person's transactions by category first - for example, by week, month, or year. Once grouped, you can apply functions like frequency or total cost, for example, and then apply the linear trend function to the result. This lets you explore patterns such as someone's weekly rail travel costs, monthly supermarket spending, or yearly charity donations.
Example
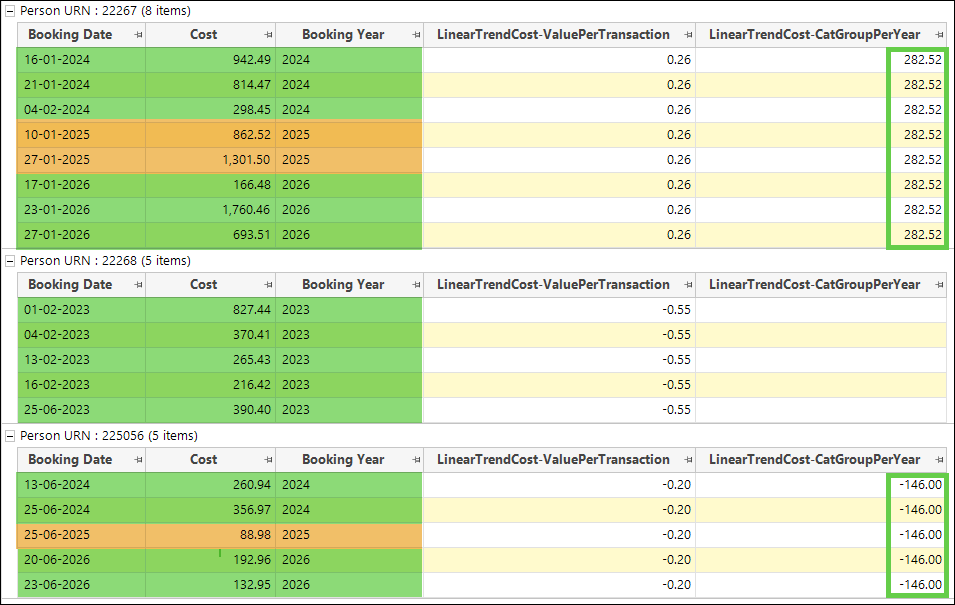
In the data grid above, the Linear Trend (slope) function has been used with the Value aggregation to provide a per transaction/daily output result, and the Category Grouping aggregation to provide an annualised view of the relative increase or decrease in a person's holiday costs for the years in which they have made bookings.
Note
The daily and yearly values are incomparable.
For example:
- Person URN 22267 has made 8 bookings across 3 years and returns a positive linear trend slope value of 282.52.
- Person URN 225056 has made 5 bookings across 3 years and returns a negative linear trend slope value of -146.00.
- Person URN 22268 has also made 5 bookings but, since the linear trend calculation requires at least 2 data points (here years), and this person's bookings all fall within the same year, there is no annualised linear trend slope value to return.
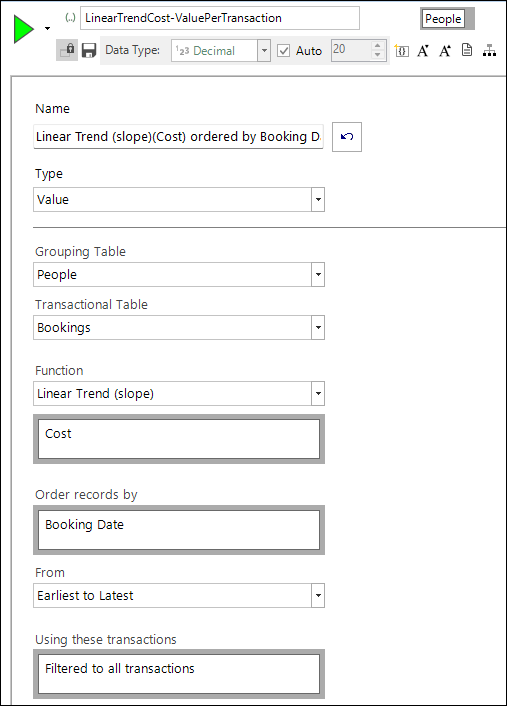
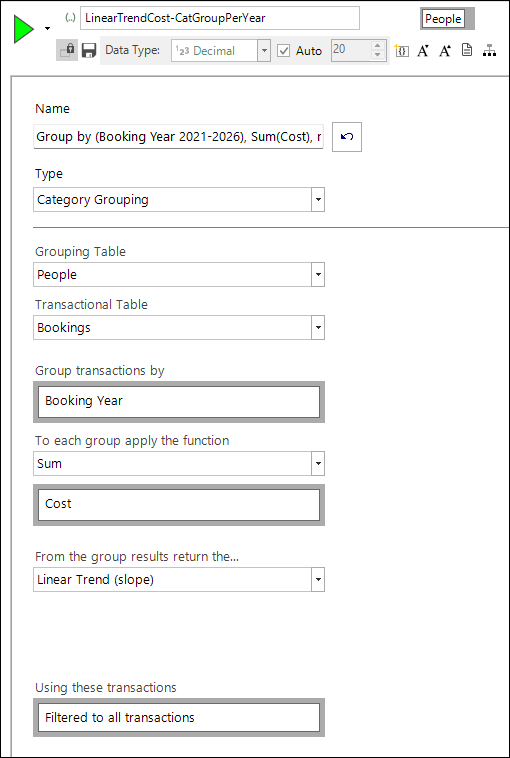
The on the fly aggregation expressions used to create this data grid are:
Related topics: