N% per variable selection
In addition to carrying out N per variable sampling, you can also carry out N% per variable or expression sampling in a selection. This satisfies the common requirement of sampling N% of records whilst maintaining distribution across the selected variable or expression.
Example 1
-
Create a selection that identifies people who are Directors, Managers, or Professionals.
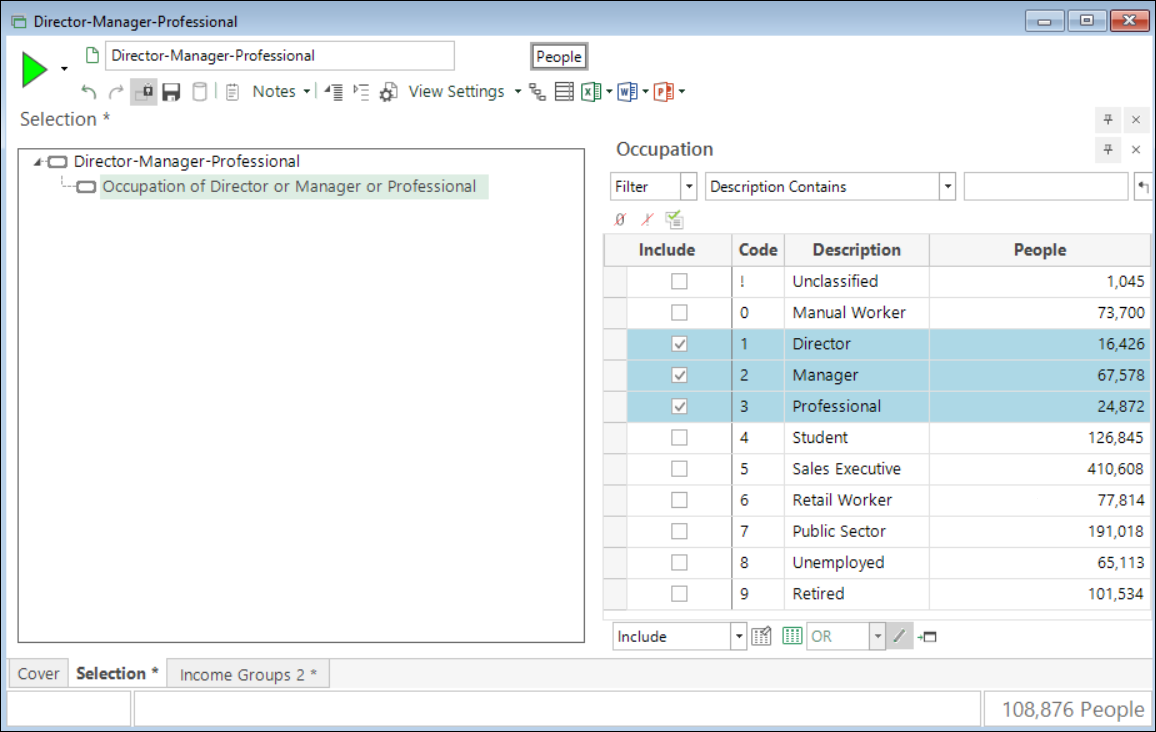
Imagine that of the 108,876 people identified, you are interested in creating a 10% sample based on income group - low, middle and high. If you drop a cube onto the selection above and add Income Groups as a dimension, you can see the counts of people in each group. Adding the % Column statistic then allows you to see the distribution of records across the categories.
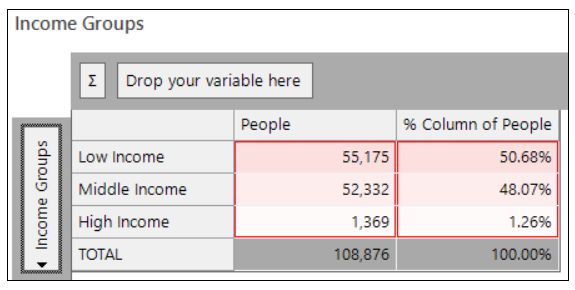
To create a 10% sample based on income groups, whilst maintaining the distribution for the records selected, return to the selection tab and:
-
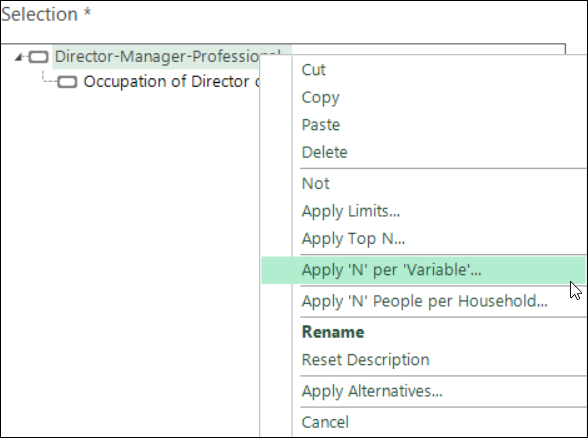
Right click on the selection summary row and select Apply 'N' per 'Variable'.
-
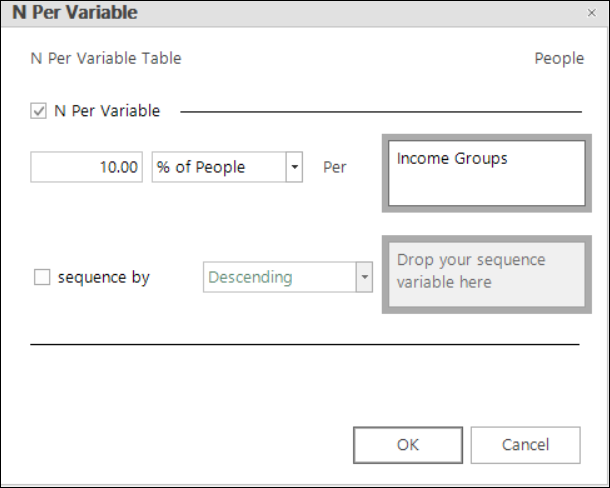
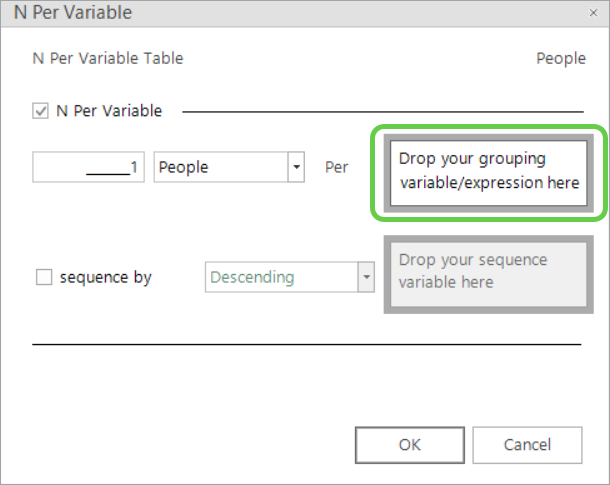
Click on the People drop-down and select % of People then set the required percentage - e.g. 10%.
-
Drag and drop your grouping variable onto the drop-box - e.g. Income Groups.
-
Click OK and rebuild.
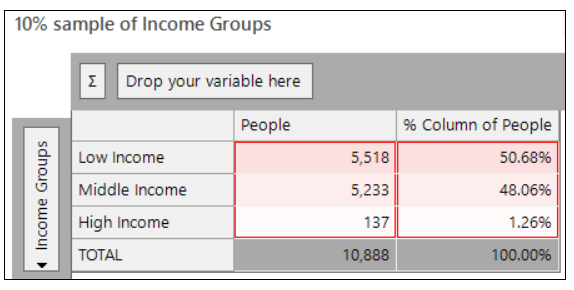
You can now see that 10,888 people are selected, and that the distribution across the low, middle and high income groups remains constant.
Example 2
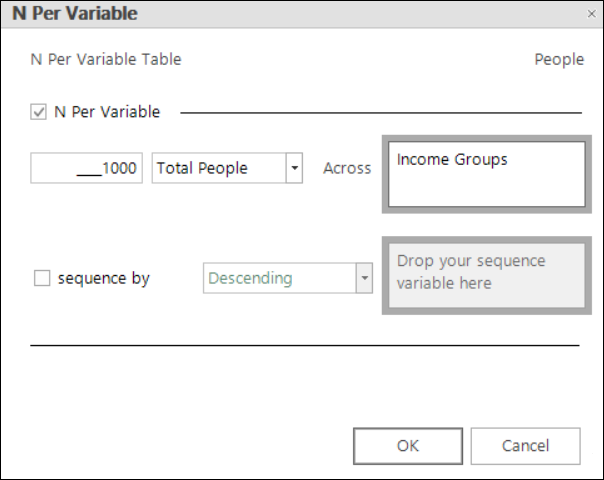
There may be occasions when you want to sample a specific number of records but still maintain distribution. You can achieve this using the third option in the N Per Variable dialogue - selecting Total People. For example, to modify and select a total of 1000 people, return to the selection tab and:
-
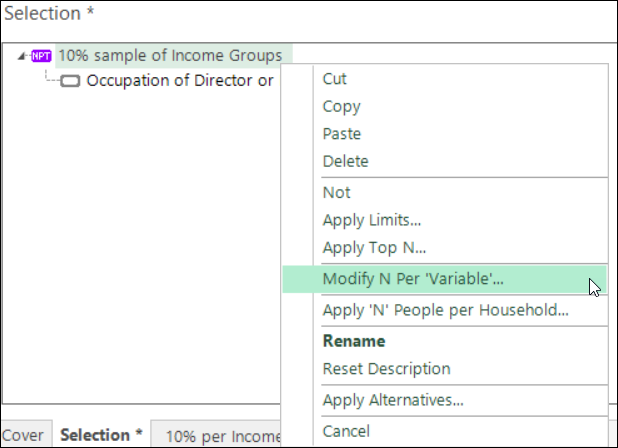
Right click on the selection summary row and select Modify N Per 'Variable'
-
Select Total People and set a total of 1000 records to be selected across Income Groups.
-
Click OK and rebuild.
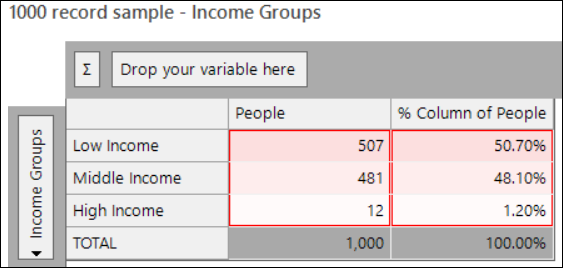
You can now see in the cube display that the distribution is maintained (allowing for appropriate rounding) and the number of people per income group selected accordingly.
When appropriate or necessary, you can group by an expression instead of a variable to carry out your sampling.
Related topic: