Graphical view charts
There are several charts available to select from through the Graphical View tab.
-
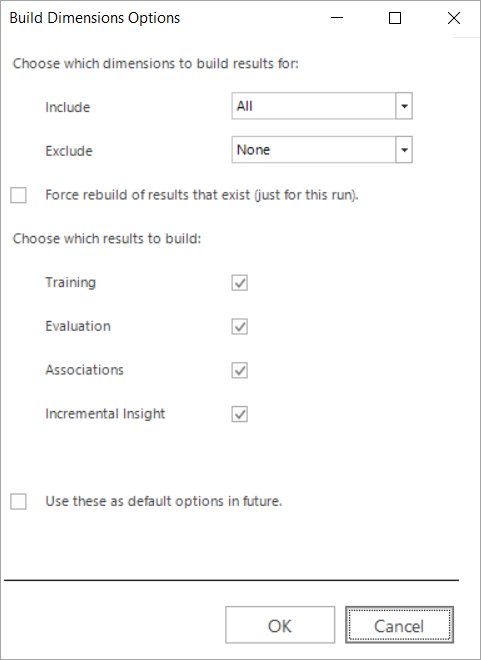
Build the modelling environment with all results options selected:
-
Select the type of chart and date you want to study:
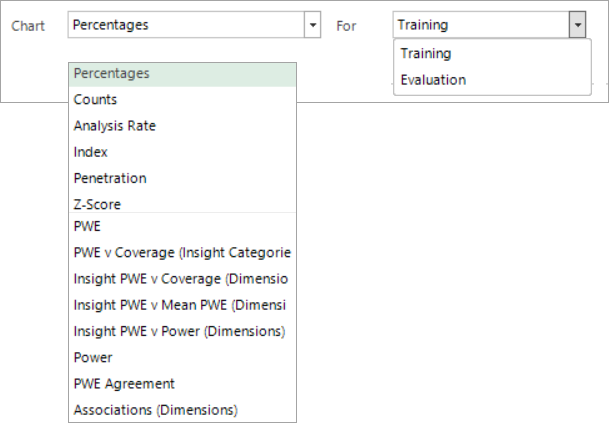
Compare training and evaluation data
You can view the data on the training date, the evaluation date and, when relevant, the data for both dates side by side. The approach you take varies depending on context and the stage of the process you are at.
-
On first creating the dimensions you are likely to choose to view the data for the training date so that you can identify which dimensions are predictive on that date.
-
When you have a hypothesis about which dimensions are useful and predicitve, you may then choose to view the data on the evaluation date to ensure the dimensions remain predictive when checked on a date when the behaviours are known.
-
This process is aided (when available) by the option to display the training and evaluation data side by side.
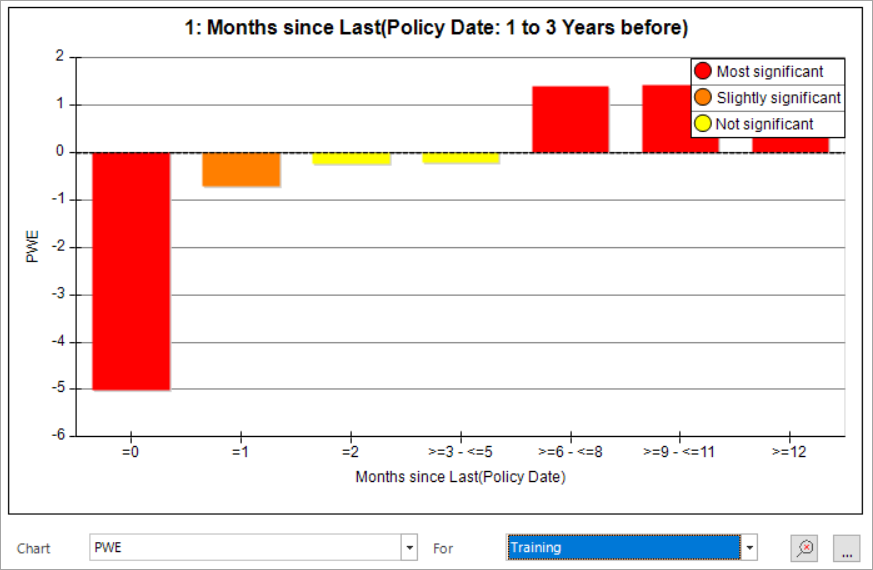
The results displayed in the chart below suggest that the dimension is predictive:
This is confirmed when looking at the evaluation data below:
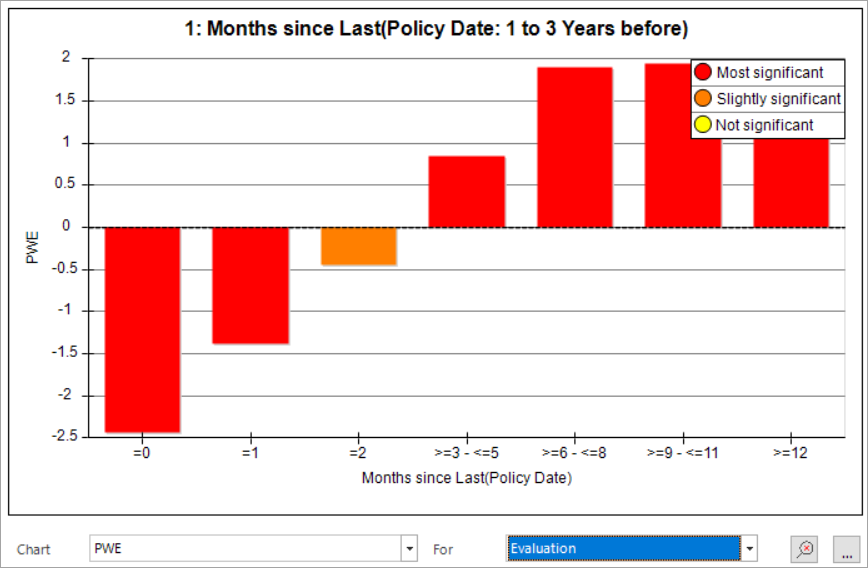
Viewing the training and evaluation data together demonstrates that they mirror each other:
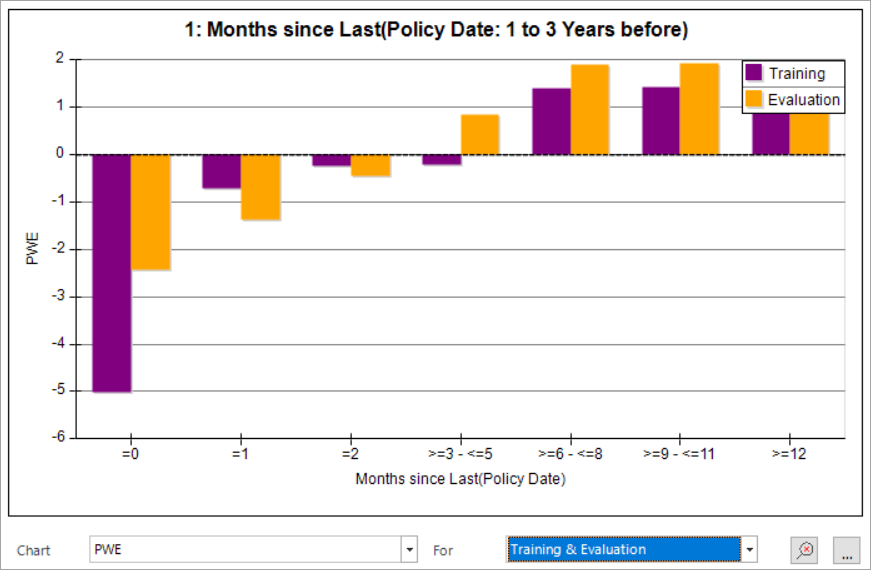
As you look at different dimensions and compare the data on the evaluation and training dates, you may see examples of where the evaluation data does not mirror the training data and, consequently, choose to discount such dimensions when building the model.
See Interpretation of charts for an explanation of each chart type.