Territories wizard
The Territories wizard provides a mechanism for creating maps which are thematically shaded according to number of people, or some other metric of your choosing, such as average holiday cost, for example.
There are three ways to work with this wizard:
-
Create territories from shapefile
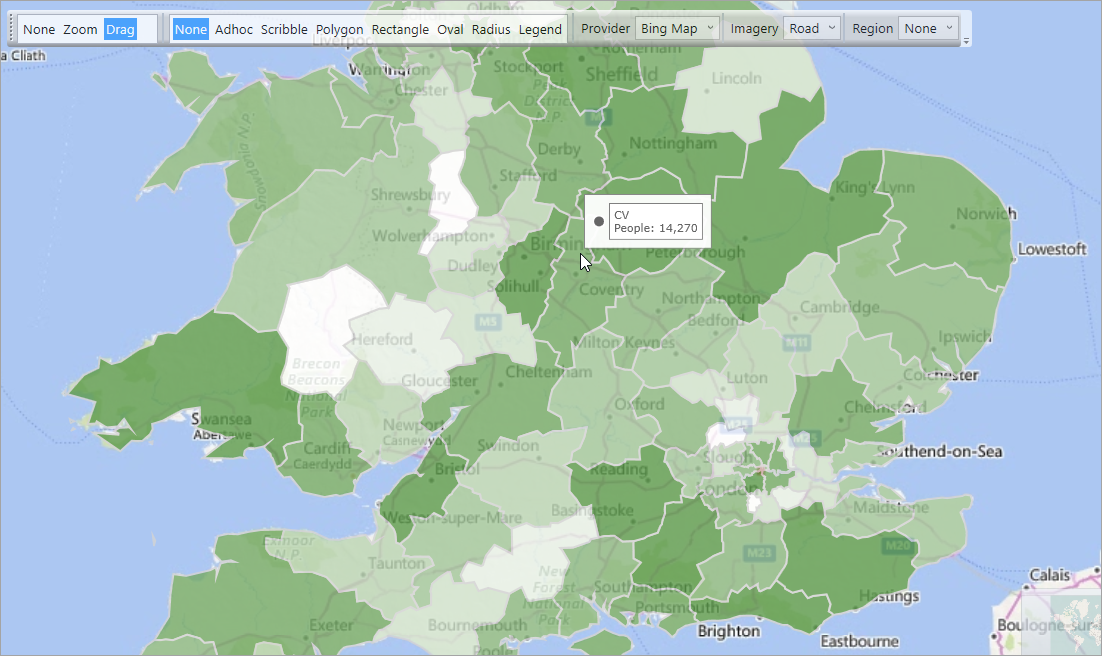
Create a virtual variable directly from a geographic shapefile, based on an expression, and categorising each record into the shape to which it belongs. A related JSON shapefile is simultaneously created and allows immediate use of that variable on a shaded map.
-
Create territories from map
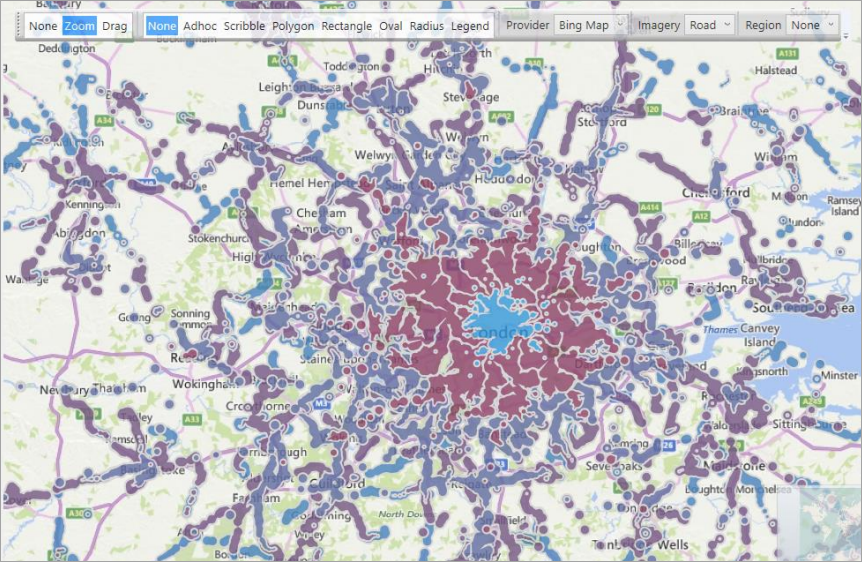
Create a virtual variable directly from selections made on a map. This allows you to quickly generate territories defined by the Map drawing tools, or through the use of drivetime selections.
-
Create shapefiles for existing variables
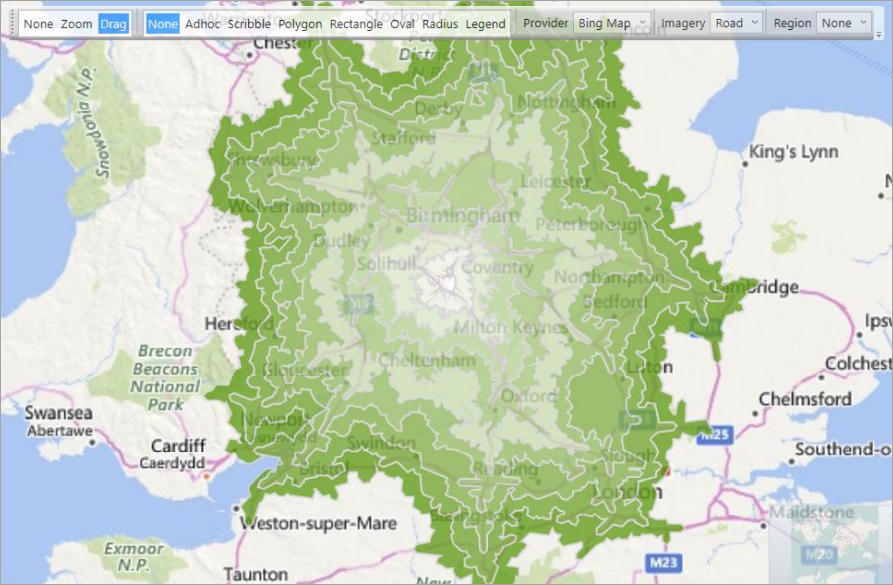
For existing virtual variables, there are options to link to a shapefile, or retrofit to a Drive Zone virtual variable.
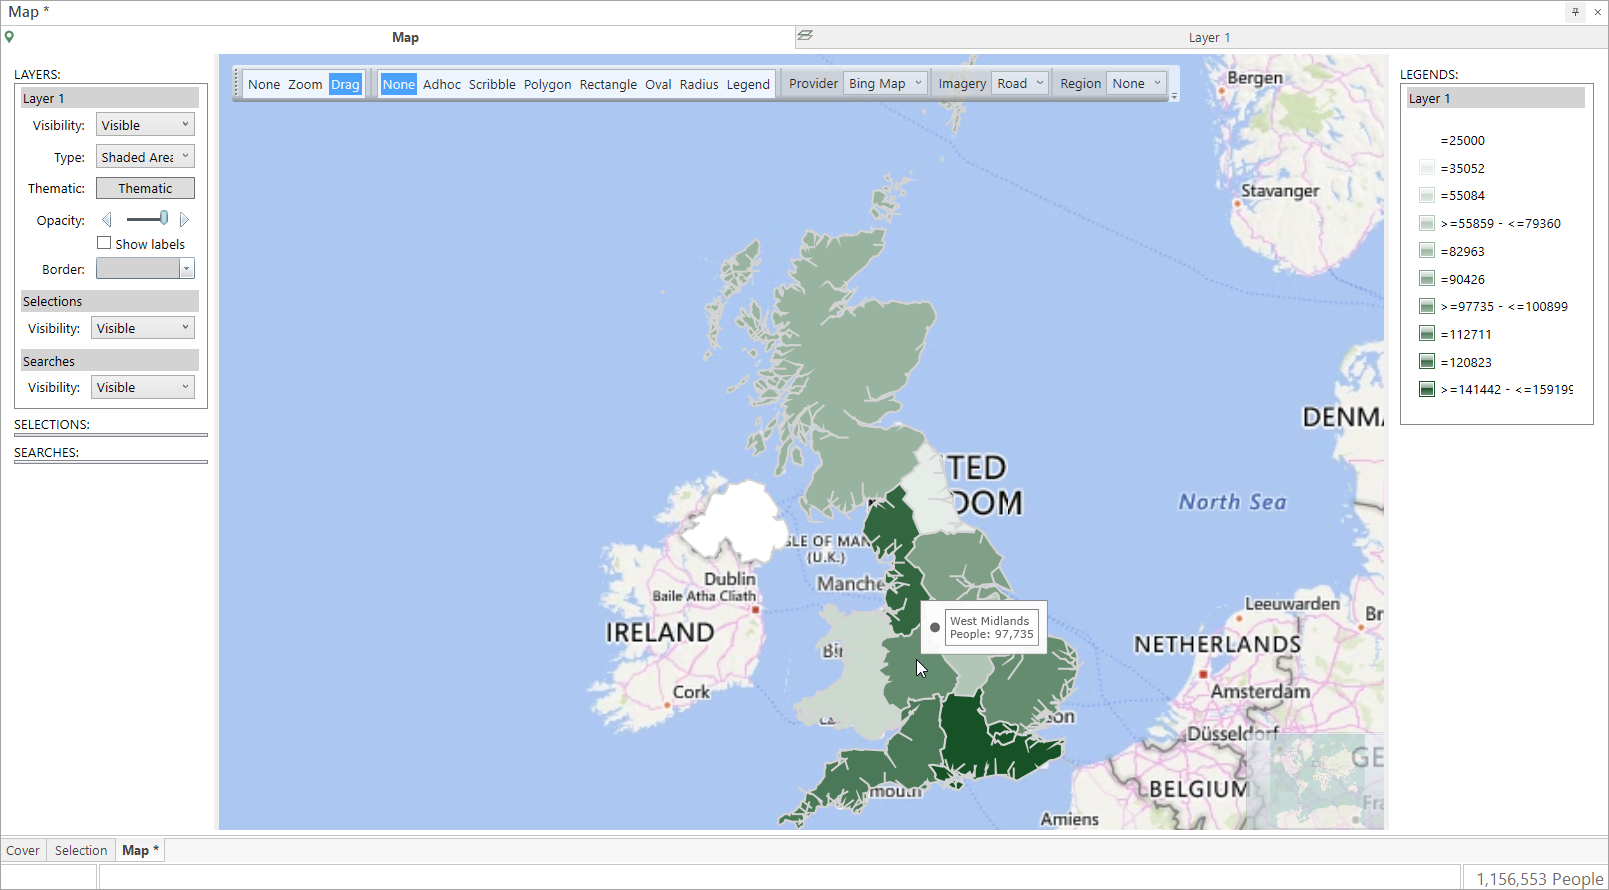
Each shape on the map represents an area and is coloured according to the defined value. You can use standard postal geography shape files - such as Postal Sector, Postal District and Postal Area in the UK; you can also create thematic maps based on alternative shape files, or your own custom territories.
Examples of shape files available from the Office for National Statistics Open Geography portal include:
- Health region boundaries
- Census boundaries
- Political or electoral boundaries
- National Parks
- Economic regions
- Police force areas, etc.
Note
To create a thematically shaded map, the territory definitions must be SHP, KML or JSON format files and, importantly, you must have a variable in FastStats which matches each record to an area on the map. This means that there must be a link between the codes/descriptions of the variable in FastStats and the shape file you use.
The following example demonstrates how to use the Territories wizard with a JSON file of UK regions to generate a virtual variable that you can then use to create a thematically shaded map visualisation.
To get started:
- From the Wizards ribbon bar, select the
 Territories wizard to go to step 1 - Bing Map Territories
Bing map territories
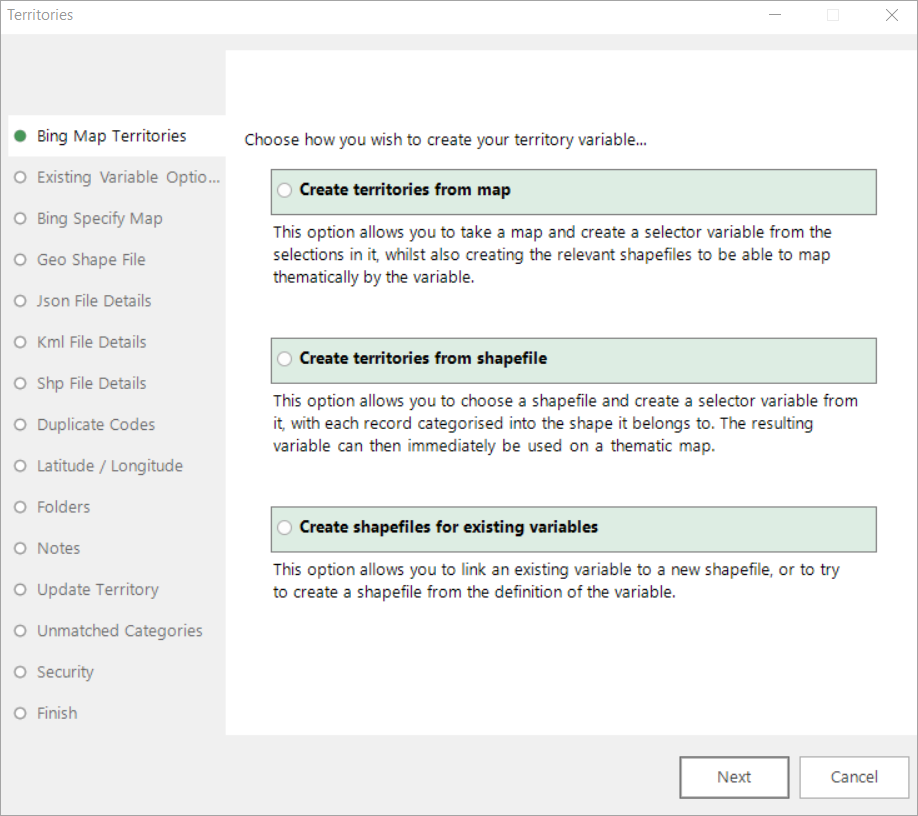
In the first step of the wizard, select your method for creating the territory variable. You can:
- Create territories from map
- Create territories from shapefile
-
Create shapefiles for existing variables
-
Select Create territories from shapefile
This will take you directly to the Geo Shape File step.
Alternatively:
- Selecting Create territories from map takes you to the Bing Specify Map step.
- Selecting Create shapefiles for existing variables takes you to the Existing Variable Options step.
Existing variable options
When you have an existing variable in your FastStats system you can select to Create shapefiles for existing variables at the first step and associate that variable with a new shapefile, without needing to define the variable from the shapes.
When you opt to Link new shapefile to existing variable, there must be a match between the codes/descriptions in the selector variable and the shapefile. It is also possible for multiple variables to reference the same shapefile - for example you may have two variables - one for Home Postal Sectors and the other Work Postal Sectors - which reference the same Postal Sector shapefile.
Selecting Create shapefile for an existing virtual variable allows a new shapefile to be created from an existing drive zone variable and you can then create thematically shaded maps as a result.
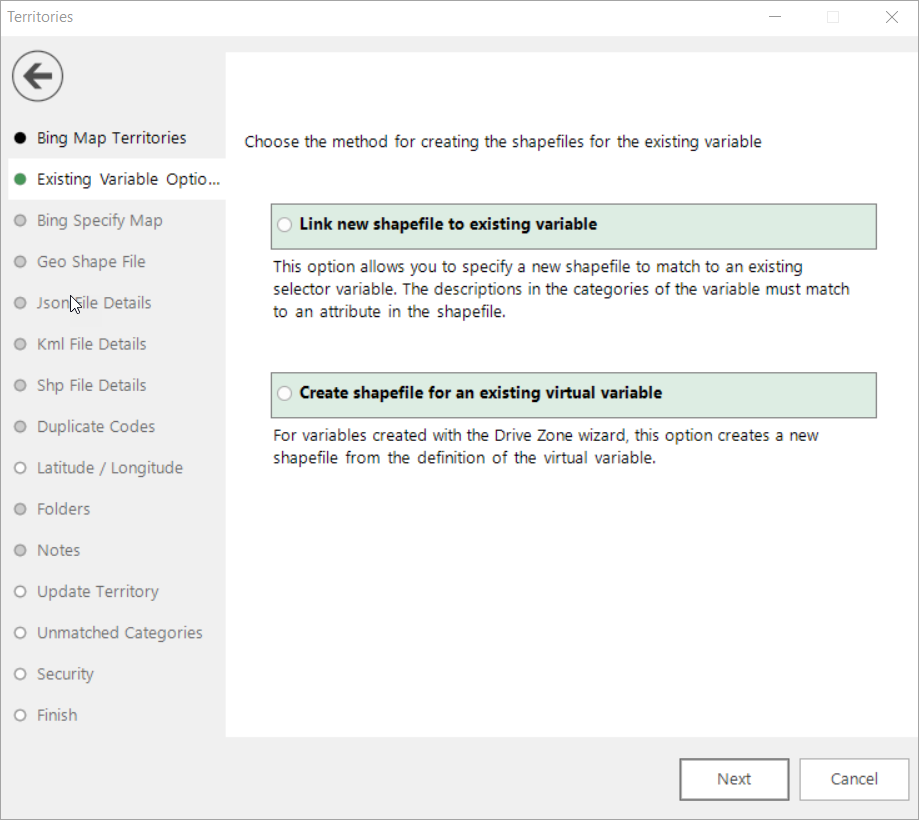
Selecting Link new shapefile to existing variable takes you directly to the Geo Shape File step to choose the format of your shapefile.
Selecting Create shapefile for an existing virtual variable takes you directly to the Latitude / Longitude step.
Bing specify map
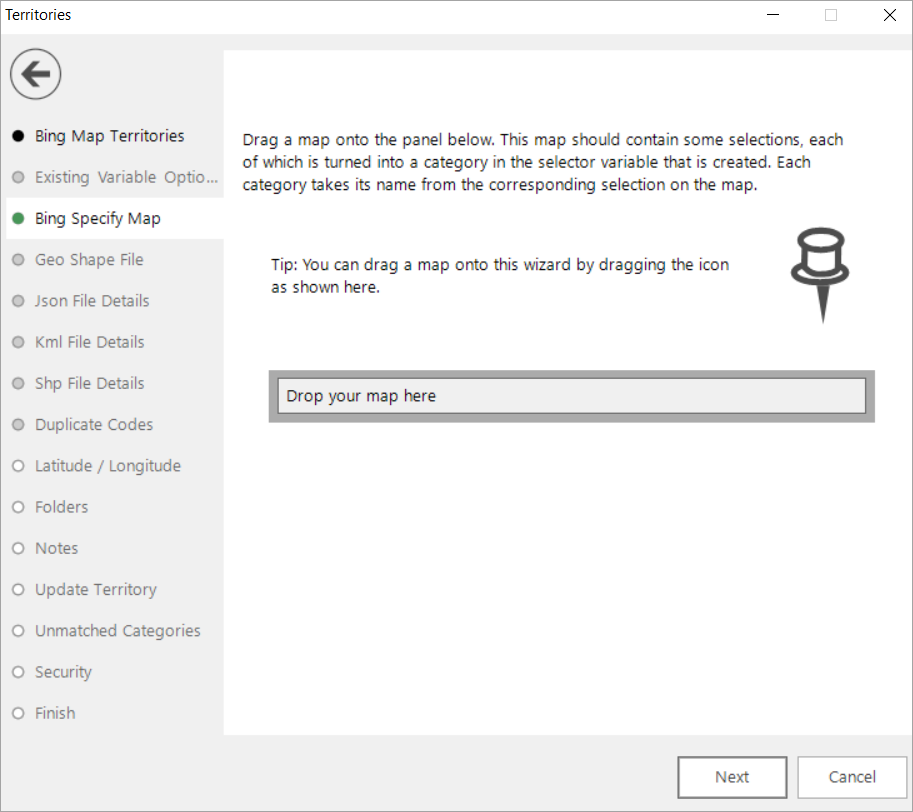
Selecting Create territories from map allows you to create customised territories based on selections that you make using the Map tool.
First you must draw your shapes on a map; each shape is then turned into a code within a selector variable before you can use that variable to create a thematically shaded map. For example, you may draw particular sales regions, or create multiple drive times or public transport zones. You can also use the Drive Zone wizard to create zones, each of which is associated with the shape it creates, and then use this to visualise, for example, how far customers will travel to a particular store or venue.
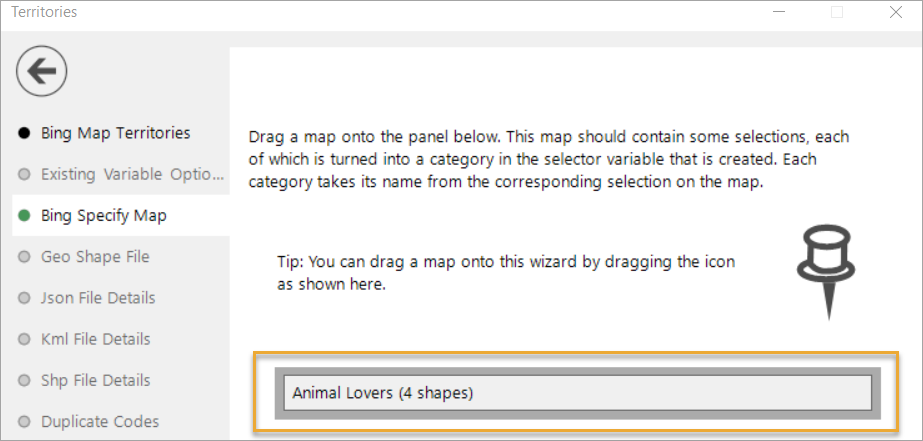
The map below displays map selections related to 30 minute drive times around tourist attractions that might appeal to animal lovers:
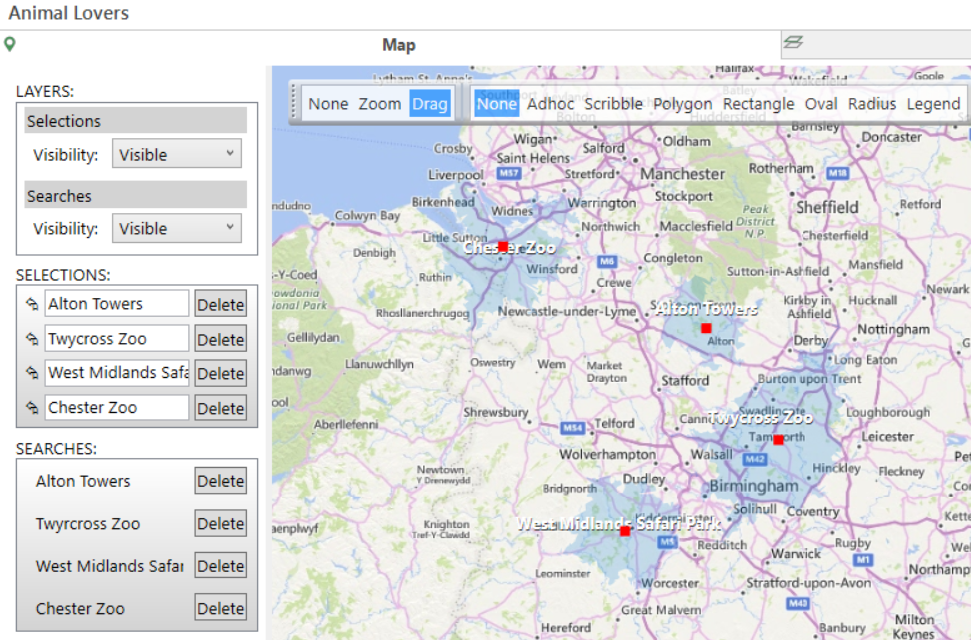
Name and drag the map onto the drop box in this step of the wizard:

Geo shape file
At this step you must determine the type of shape file to use - JSON, .shp or KML.
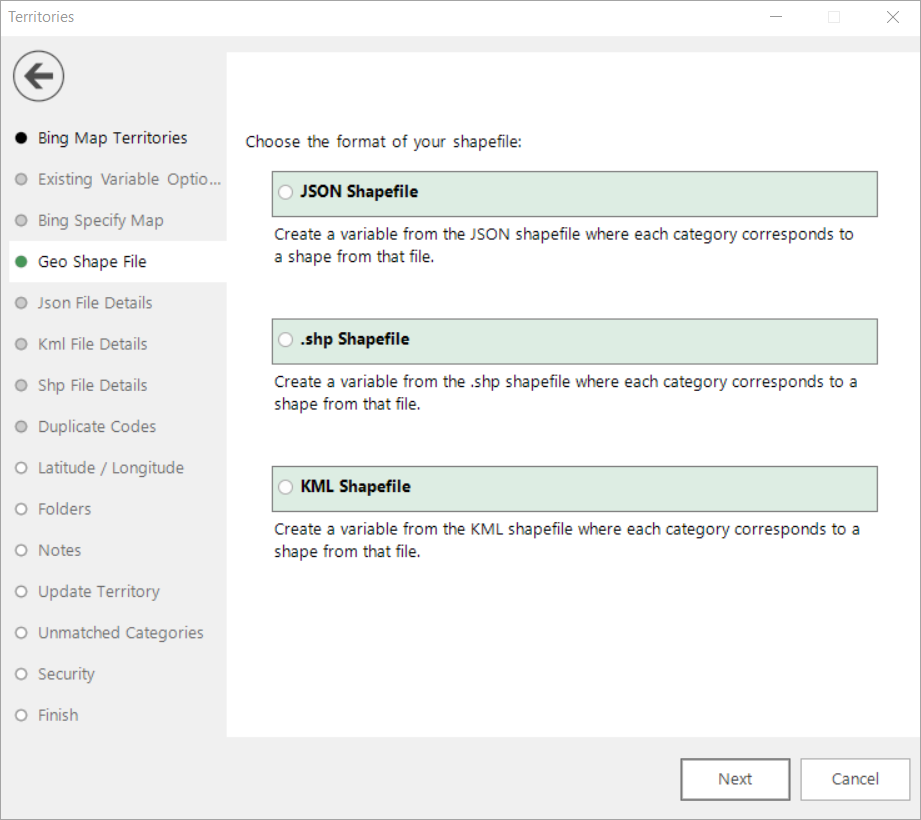
When you select the format of your shapefile you will move to the corresponding step to add the file details. For example:
- Select JSON Shapefile to move to JSON File Details
JSON file details
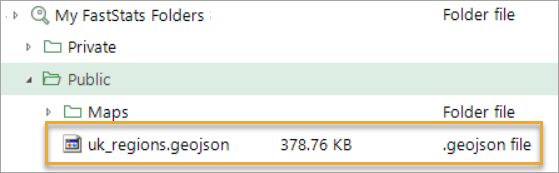
The shapefile you wish to use must be saved into a public or private folder within My FastStats Folders, located in the Files explorer.
-
Drag and drop the shapefile onto the drop zone
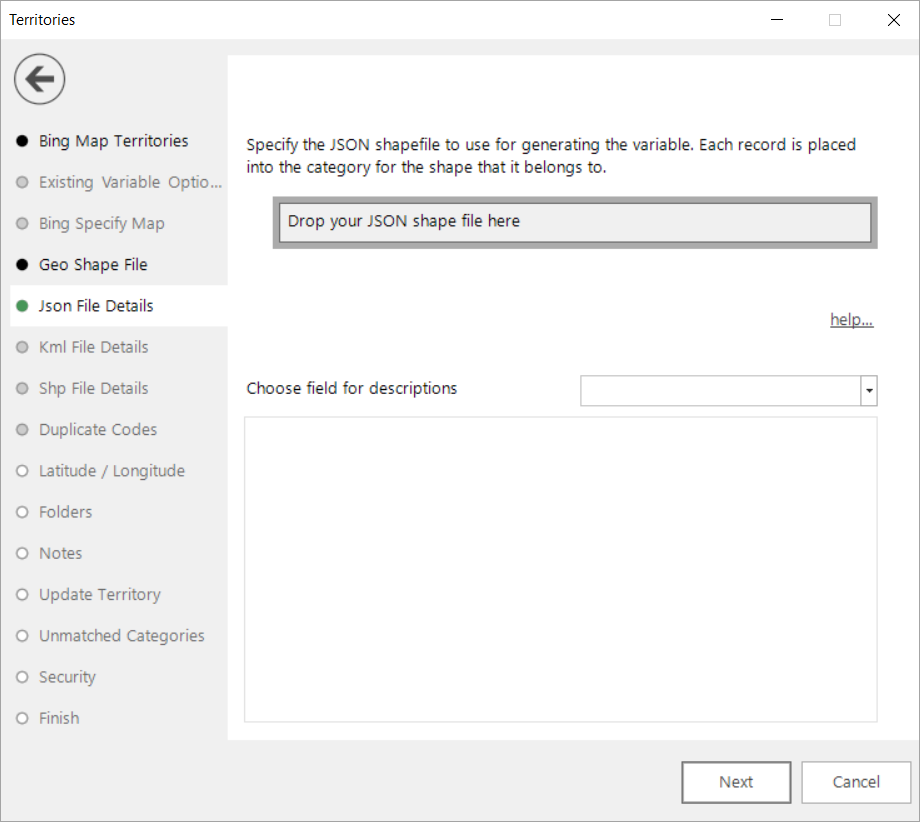
The number of shapes in the file is displayed and you must then select the field you wish to use for the category descriptions in the virtual variable you are creating.
To make it easier to select an appropriate field, a preview of the type of data held in each field is displayed:
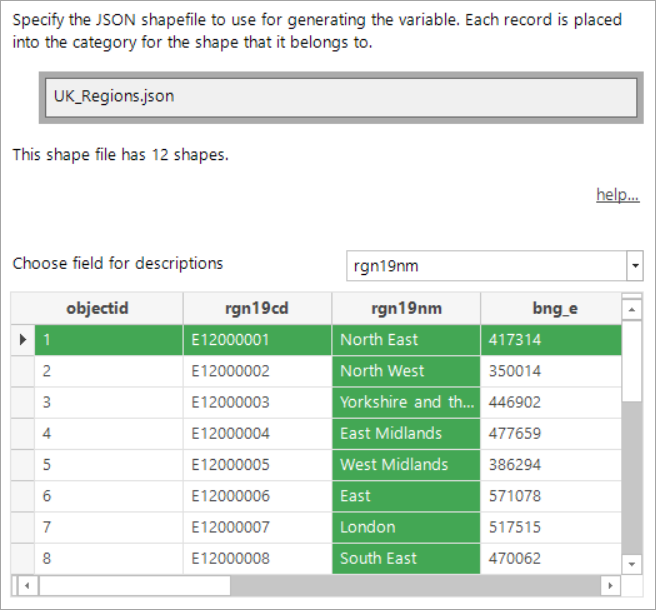
In the above example, there are 12 shapes identified - in this case UK regions - and the region name will be used to create the variable codes and descriptions.
- Select your field from the drop-down options or, alternatively, click on the header of the required field column
KML file details
The shapefile you wish to use must be saved into a public or private folder within My FastStats Folders, located in the Files explorer.
-
Drag and drop the shapefile onto the drop zone
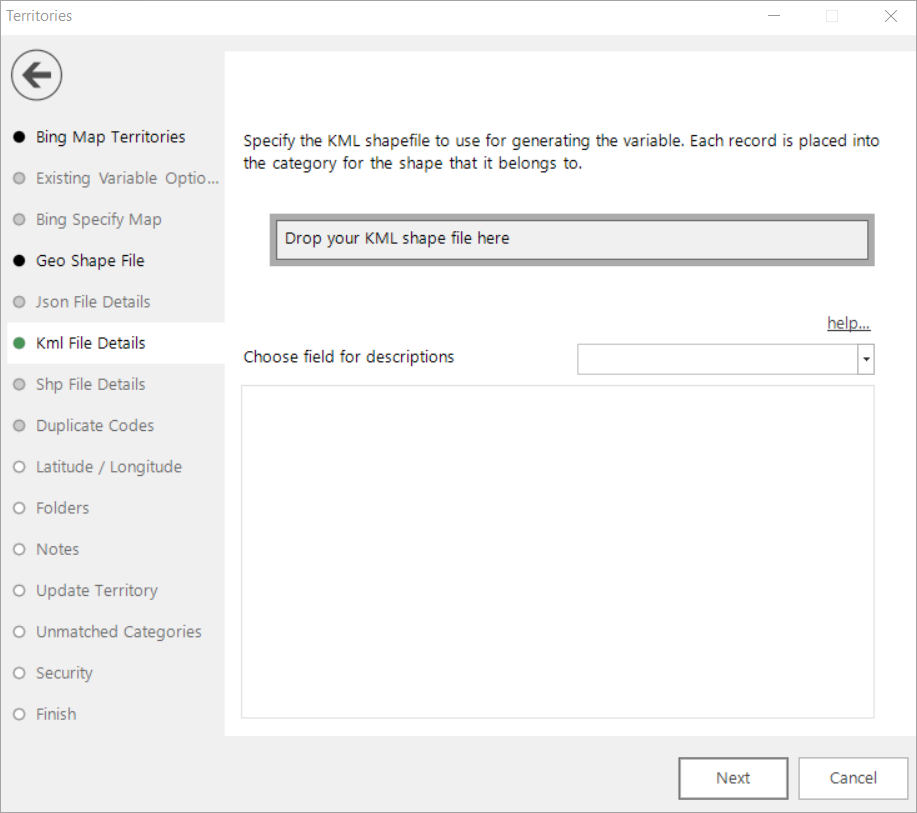
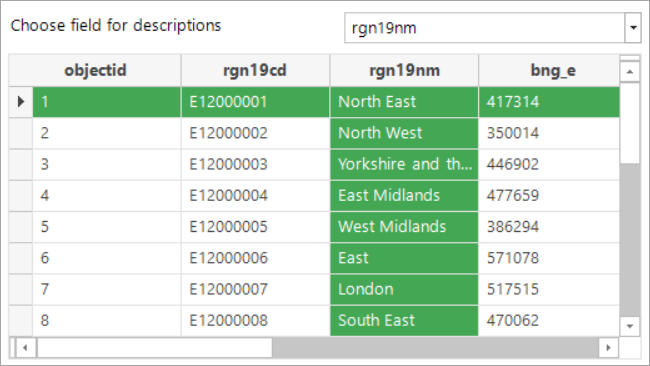
The number of areas in the file is displayed and you must then select the field you wish to use for the category descriptions in the virtual variable you are creating.
To select the field to use for the category descriptions in the selector virtual variable that will be generated, you can use the Choose field for descriptions drop-down or, alternatively, click on the header of the required field column in the preview grid:
Shp file details
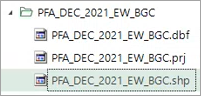
The files you wish to use must be saved into a public or private folder within My FastStats Folders, located in the Files explorer. When working with Shp files, the .dbf and .prj files are also required.
-
Drag and drop the files onto the drop zones
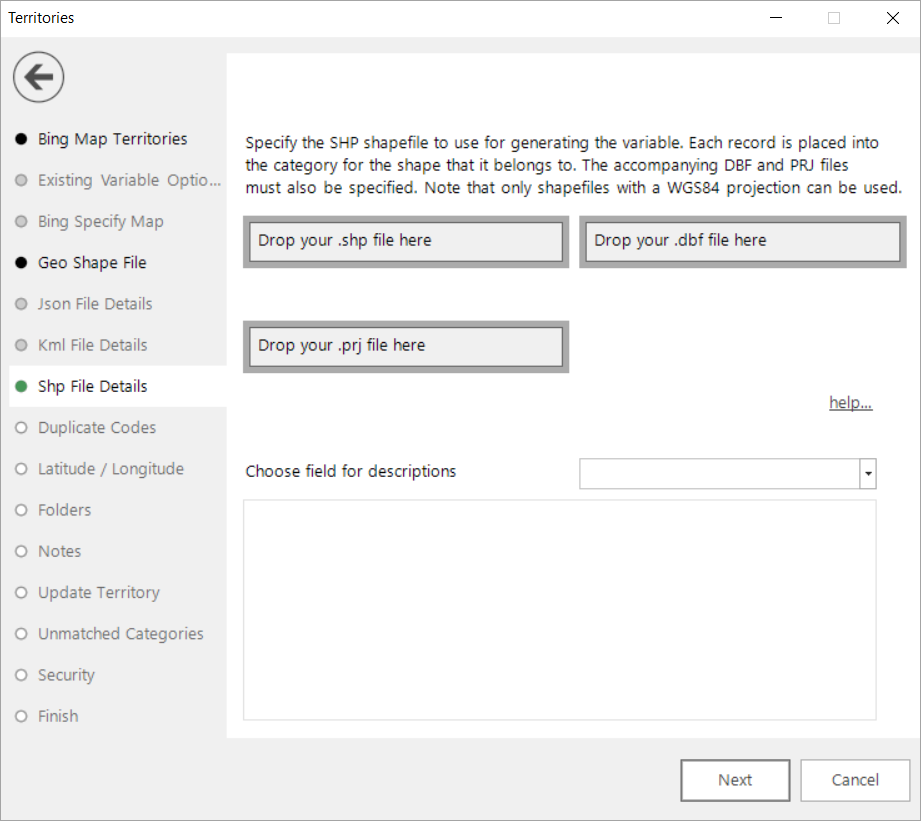
The number of shapes in the file is displayed and you must then select the field you wish to use for the category codes or descriptions in the virtual variable you are creating. You can do this via the Choose field for descriptions drop-down menu or, alternatively, by clicking on the header of the required field column in the preview grid:
Duplicate codes
There may be occasions when a shapefile has duplicates in the field that you have selected as your description. This will prevent the underlying expression from working and the shapefiles from plotting correctly.
If duplicates are found, you are presented with a list of the codes and descriptions for editing:
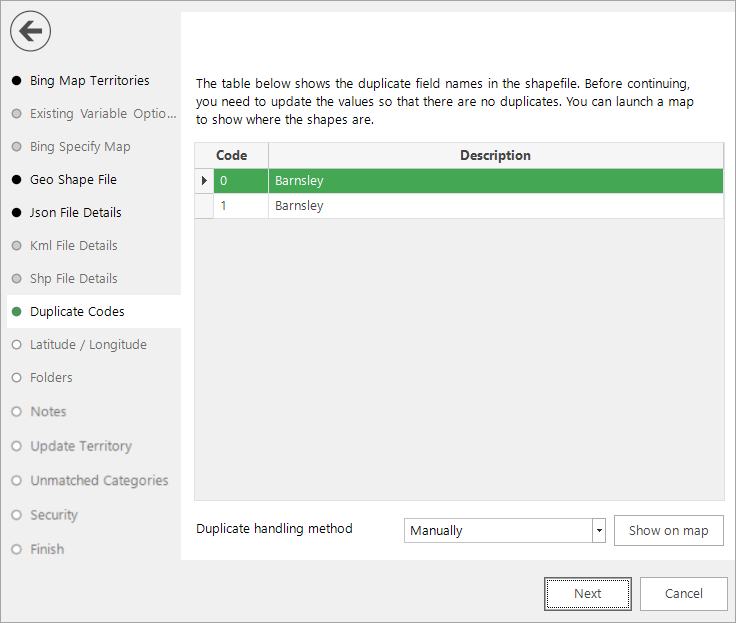
You can select the method for handling duplicate items by clicking on the drop-down menu:
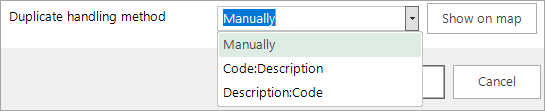
For example, you can manually edit the items or concatenate them so that they are unique. There is also the option to launch a map and visually see where the duplicates lie.
Latitude / longitude
Where only one latitude and one longitude variable is available in a system, these fields will auto-populate.
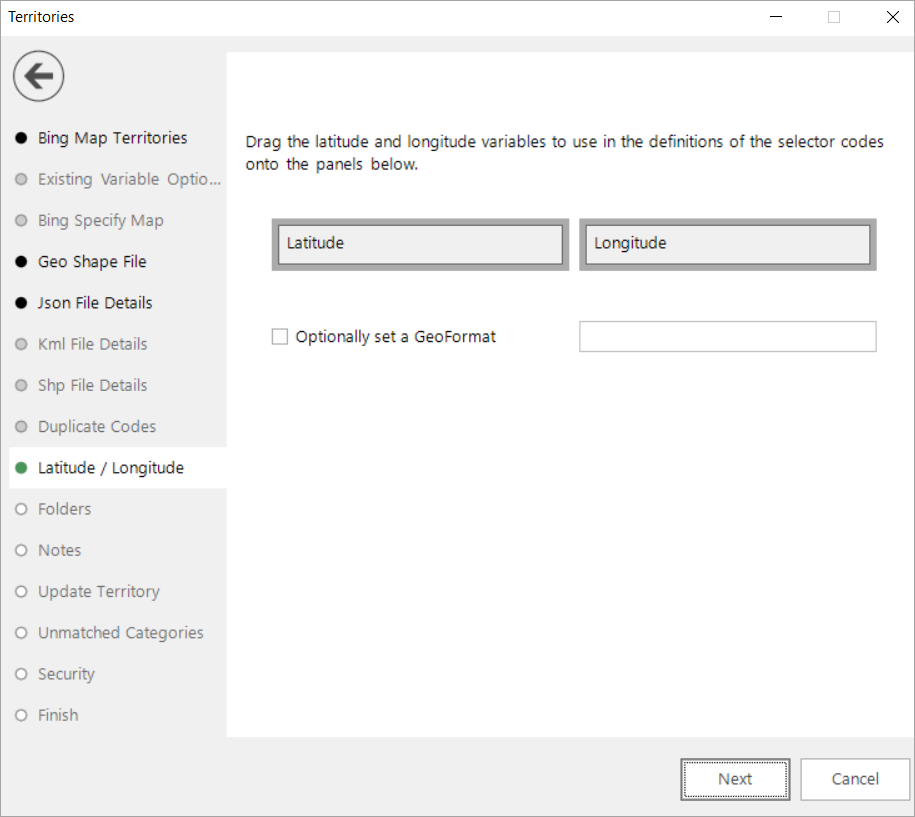
Otherwise you should select and drag the relevant variables onto the drop boxes. Alternatively:
In Map wizards, where you need to specify latitude and longitude variables, you can right click and access a menu option that allows you to select and add variables which are marked with the relevant GeoFormat property.
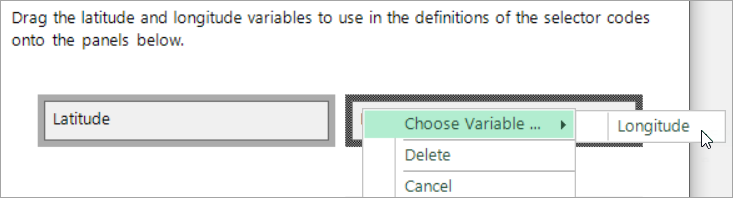
You can optionally choose to set a GeoFormat property for the new virtual variable at this step. This is a method of putting a tag alongside a variable to mark it as being a specific type of geographic 'thing' and allowing, for example, two variables to reference the same shapefile.
Folders
Choose the folder that the new variable should be created in.
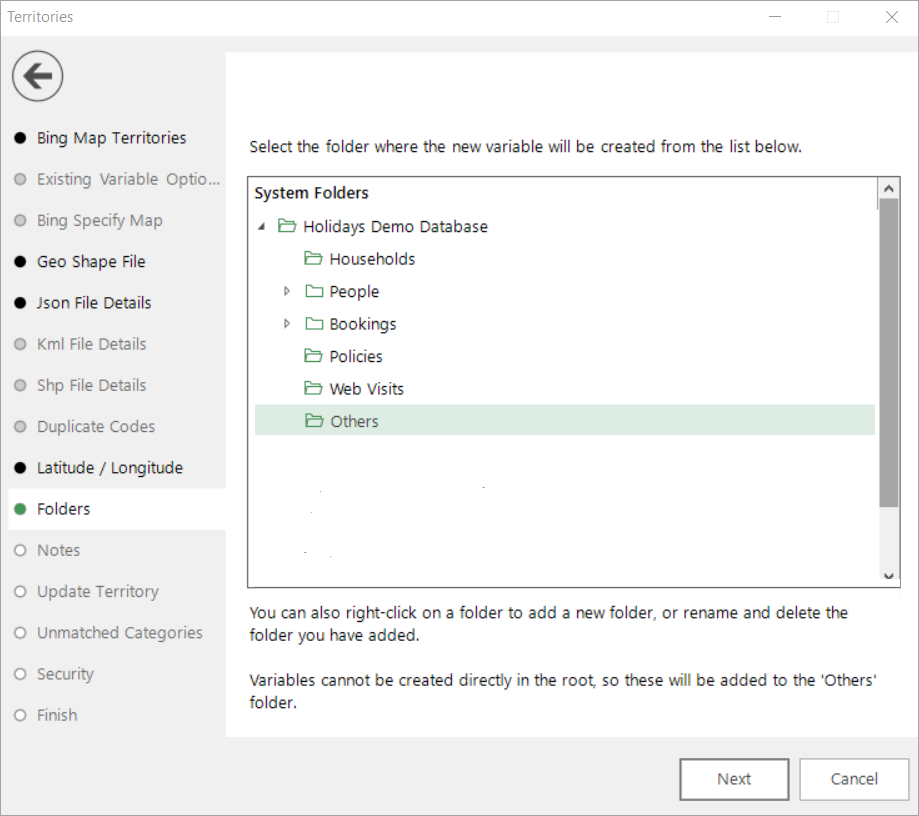
By default, the new variable is placed into the Others folder, but you can highlight an existing folder or, if necessary, create a new folder to hold your virtual variable.
Notes
You can choose to add notes to your variable.
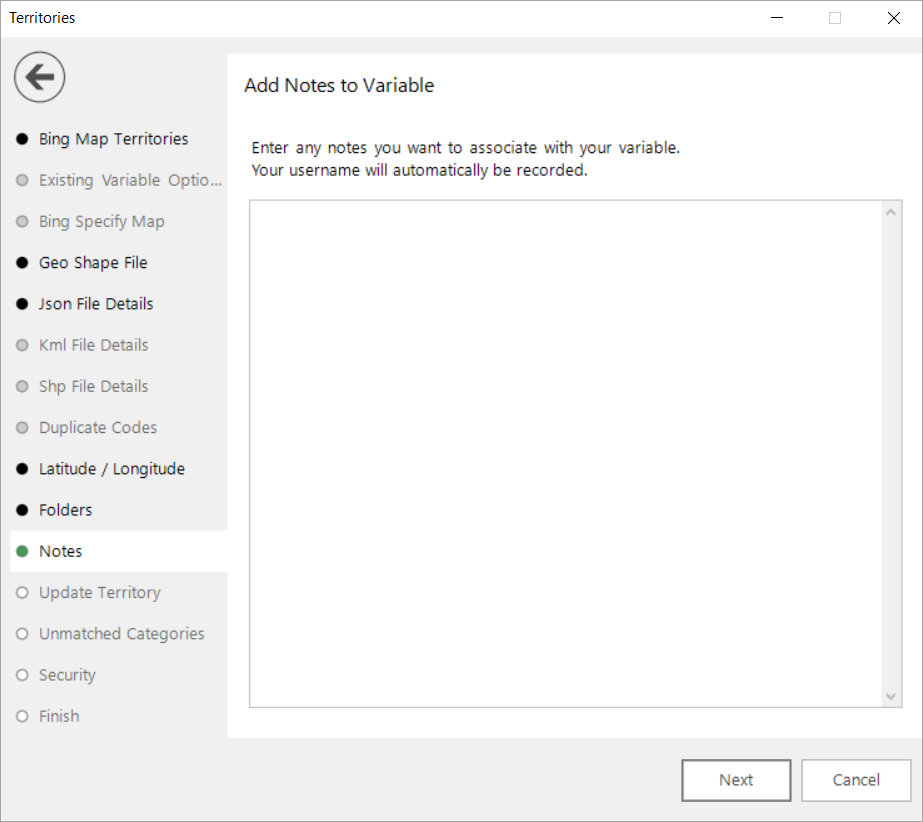
These can be viewed later by right-clicking on the variable once it is in the System explorer window.
Update territory
This step of the wizard allows you to define what the virtual variable will be called.
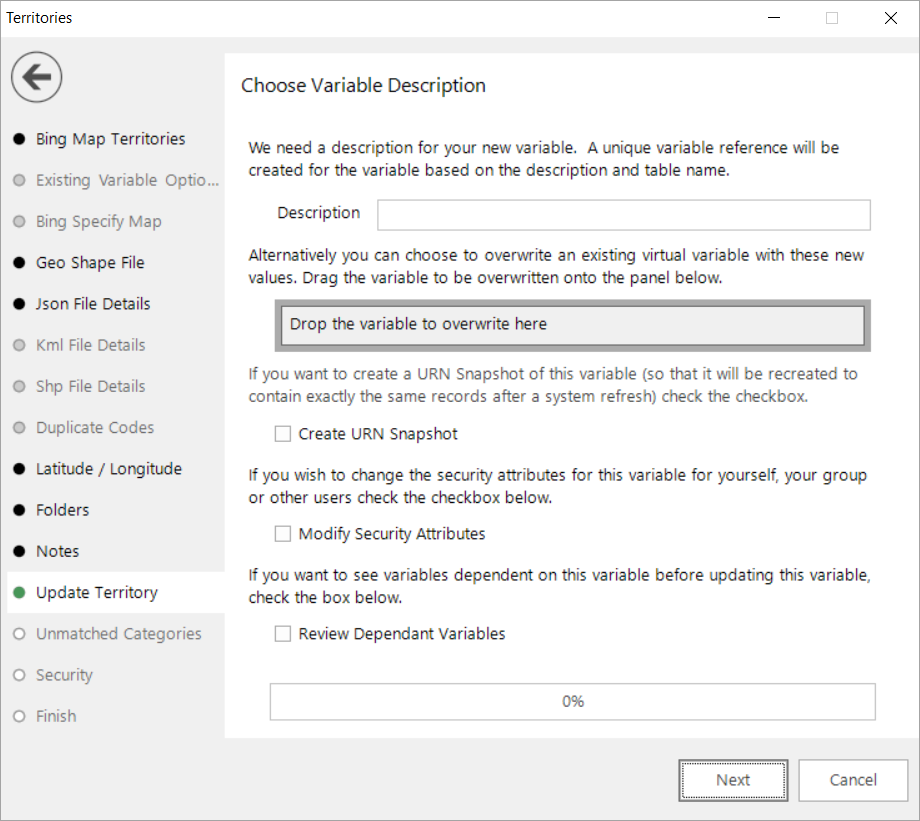
Enter the name of your variable in the Description box.
To overwrite an existing virtual variable drag it on to the Drop the variable to overwrite here drop box.
Optionally select to:
- Create URN Snapshot
- Modify Security Attributes (This option is only available on the Enterprise Version).
- Review Dependent Variables
Click Next to go to:
- Unmatched Categories - only applicable when using the Create shapefiles for existing variables option
- Security - if Modify Security Attributes is selected
- Finish - to complete the wizard process
Unmatched categories
When working with the option to link a new shapefile to an existing variable, FastStats automatically checks for categories in the selector variable which do not match those in the shapefile. You then have the opportunity to update them.
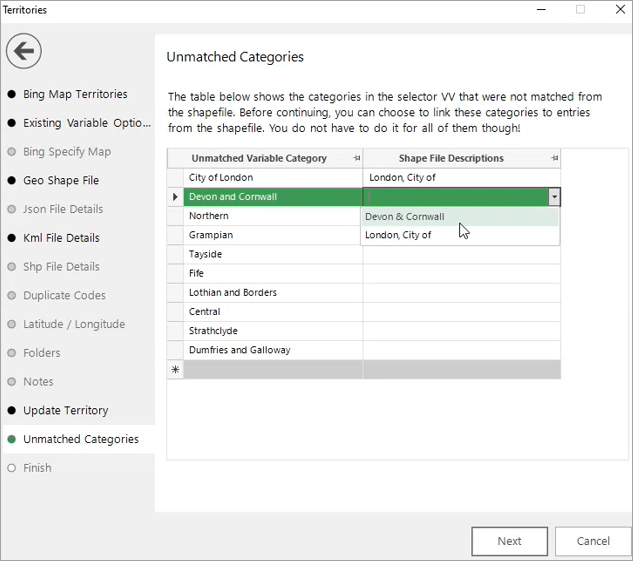
The screenshot above displays the mismatches between the description of the category in the existing variable on the left, and the descriptions in the Kml file for City of London and Devon and Cornwall on the right. Select from the drop-down to update. In this example, the shapefile does not actually include Scottish territories and, consequently, they will not appear on the thematic map when generated.
Note
If no mismatched categories are identified, the wizard skips this step.
Security
This is an optional step available on the Enterprise version of the software.
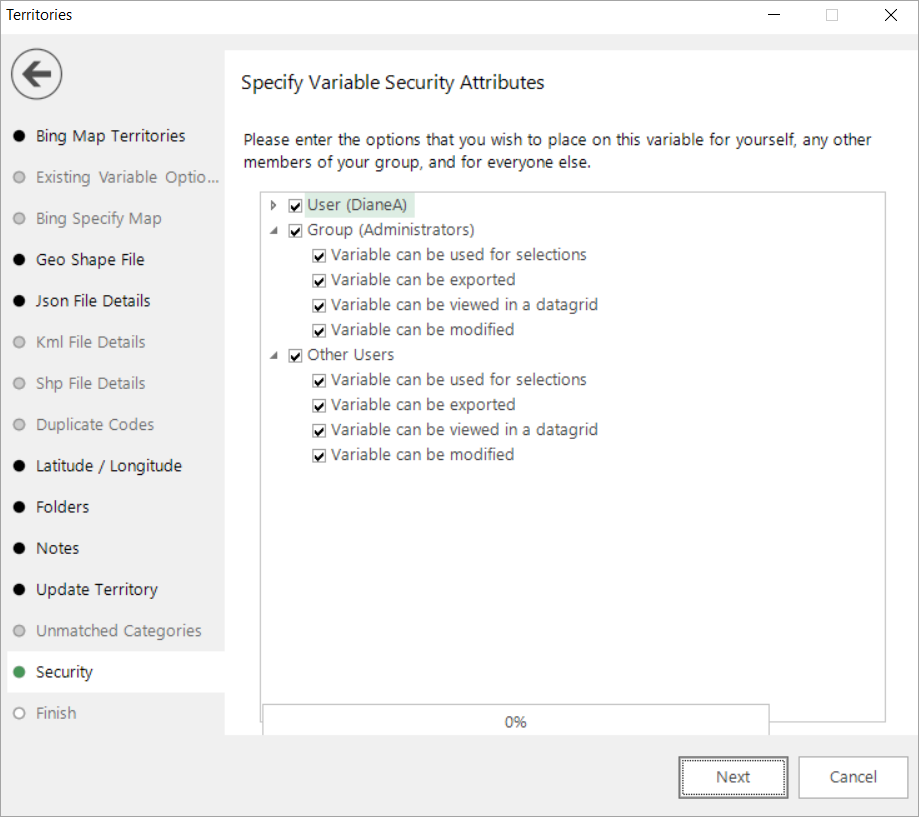
Use the tick boxes to set the security settings you wish to apply to this variable.
Finish
Once you have named your new variable (and defined any security settings for it), the final step is to create the virtual variable. Once complete, the results are displayed in the final step of the wizard.
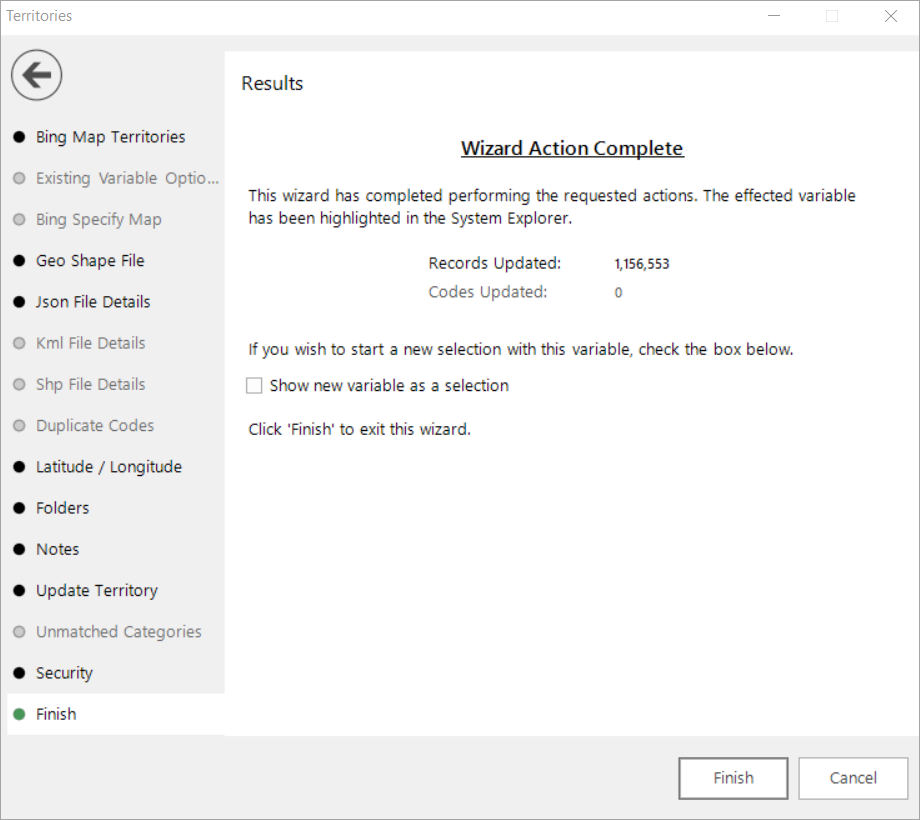
Note
Check the box Show new variable as a selection if you want to view the variable when the wizard is closed.
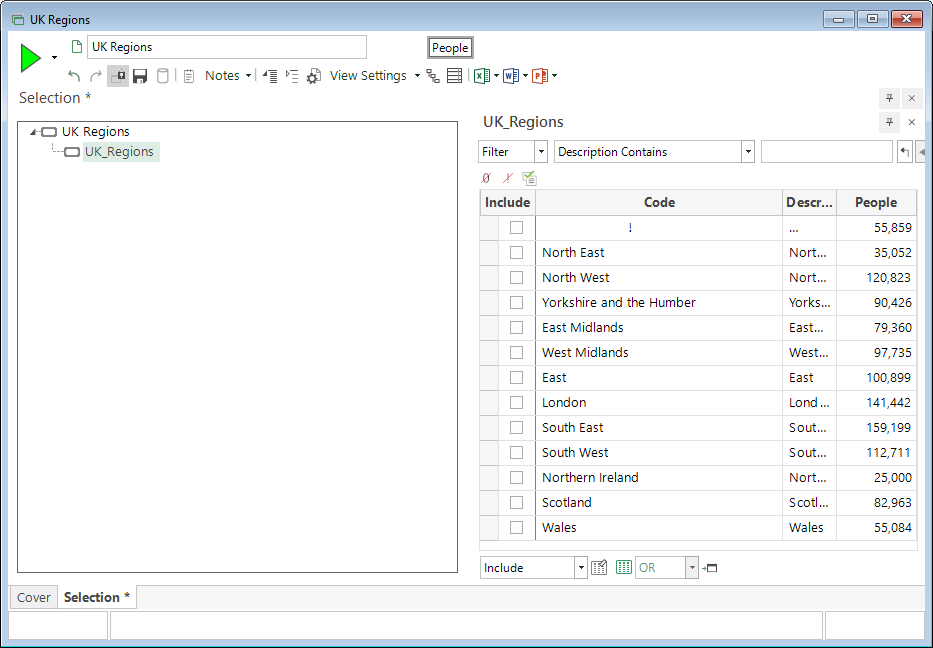
The resulting selector variable has taken its descriptions from the shapefile and a GeoJSON file has been written into the Public\Maps directory. The latter takes its definitions from the shapes in the file used so that there is a direct link and a property for each of the shapes that links up to the descriptions in the virtual variable, matching either the name or the GeoFormat.
You can create a visualisation of this data by using the variable as the geographic variable from which to create a thematically shaded map with the FastStats Map tool: