Table view
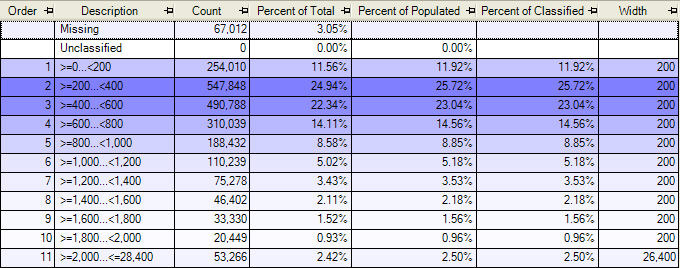
The table view enables the ranges to be viewed in a grid, where they can be sorted and where additional statistics are visible.
Shading is used to highlight the ranges which have the highest counts. Ranges with no records are displayed in white, with darker colours used for the more populated ranges. The colour used depends on the type of the ranges:
- Blue: Ranges are all the same width
- Green: Ranges are unequal in width
-
Purple: Ranges are equal in width and contain integer values.
Statistics
| Statistic | Description |
|---|---|
| Order | The position of the range within the distribution |
| Description | Description of the values contained within the range. For example, ">=200...<400": the interval includes all values greater than or equal to 200, and less than 400. Intervals containing a single value will have a description such as "=0". |
| Count | Count of records in this range. The count is at the resolve level of the variable - in this example, the count is of holidays since the cost variable is on the holidays table. |
| Percent of Total | The count of records in this range as a percentage of all the records (including those with missing values, or falling outside of a range.) |
| Percent of Populated | The count of records in this range as a percentage of all the records with a non-missing value. These percentages will often be larger than the "Percent of Total" column, since records with missing values are excluded. |
| Percent of Classified | The count of records in this range as a percentage of all the records allocated to one of the ranges. These values will sum to 100% for all the ranges in the distribution. |
| Width | The size of this range (end value minus start value). |
Note
Two additional rows appear for records that fall outside the main ranges:
- Missing: Records where the variable being banded has no value.
- Unclassified: Records where the variable being banded has a value that falls outside of the defined ranges.