Filter a chart
Filters can be applied to a Chart in a number of ways.
Using an underlying selection
Create a selection to represent the High Earners in Bristol.
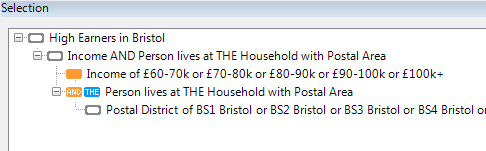
Apply a Cube with Dimensions of Income and Occupation.
Drag the Cube onto the Charting icon in the Publish section of the Toolbox to open up the Chart window.
Click Build to create the Chart.
.png)
The restrictions applied can now be seen within the Filter panel of the Chart display and the Chart itself provides a display only for the 78 High Earners in Bristol identified.
To view the full detail of a filter, or to amend the selection criteria, click on the ‘Edit filters’ box and make the required changes. Click ‘Apply’ and then rebuild the Chart to update the display.
It is possible to apply (additional) filters by selecting specific groups (e.g. columns) within the Chart itself:
Ctrl+click to select columns.
.png)
Select ‘Include’ or ‘Exclude’ as required.
Rebuild the Chart to apply the changes.
Exploring data from the entire database
When exploring your data from the entire database, first apply the Dimensions and Measures by which you wish to view your data and then:
Select specific groups (e.g. columns) of interest and exclude or include, as above. Alternatively, drag a Selection directly onto the filter panel.
Rebuild the Chart to apply the changes.
.png)
To remove all filters from the display, select ‘Clear all filters’.