Chart measures
Measures are indicated in the panels to the left and right of the Chart display and can be used to manage the statistics calculated and displayed in a Chart.
By default, the panel on the left will display the table level that the figures are shown at - for example, People, Bookings etc. - with the actual number of records being charted shown in the Count panel in the bottom left of the window.
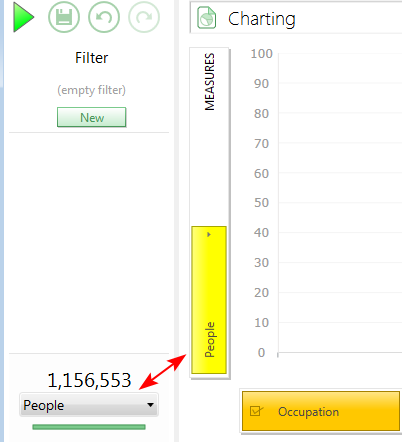
To change the resolve level, click on the drop down arrow in the Count panel and select the required table.
The count and chart display will automatically update to reflect the change.
Note
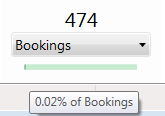
Below the count panel is a proportion bar. Mouse over the bar to see a tooltip indicating the total number of records represented in the display as a percentage of the resolve table.
Adding multiple table levels and statistics
Multiple measures can be added to the display, with users being able to switch between them. For example, to display the counts of different tables within the same charting window, drag the required table from the System Tables onto the measures panel. A visual cue indicates where this will be placed.
.png "Charting - Adding Multiple Tables")
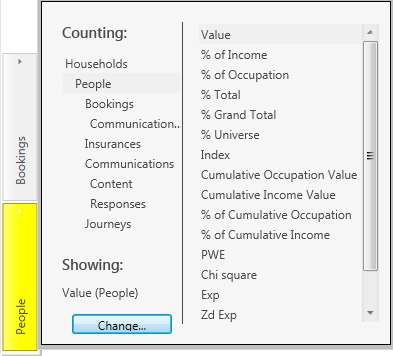
It is also possible to select a different counting level or statistic by clicking on the arrow at the top of a measure box and selecting from the menus.
Adding a numeric or currency variable as a measure
Numeric or currency variables can also be added as measures. For example:
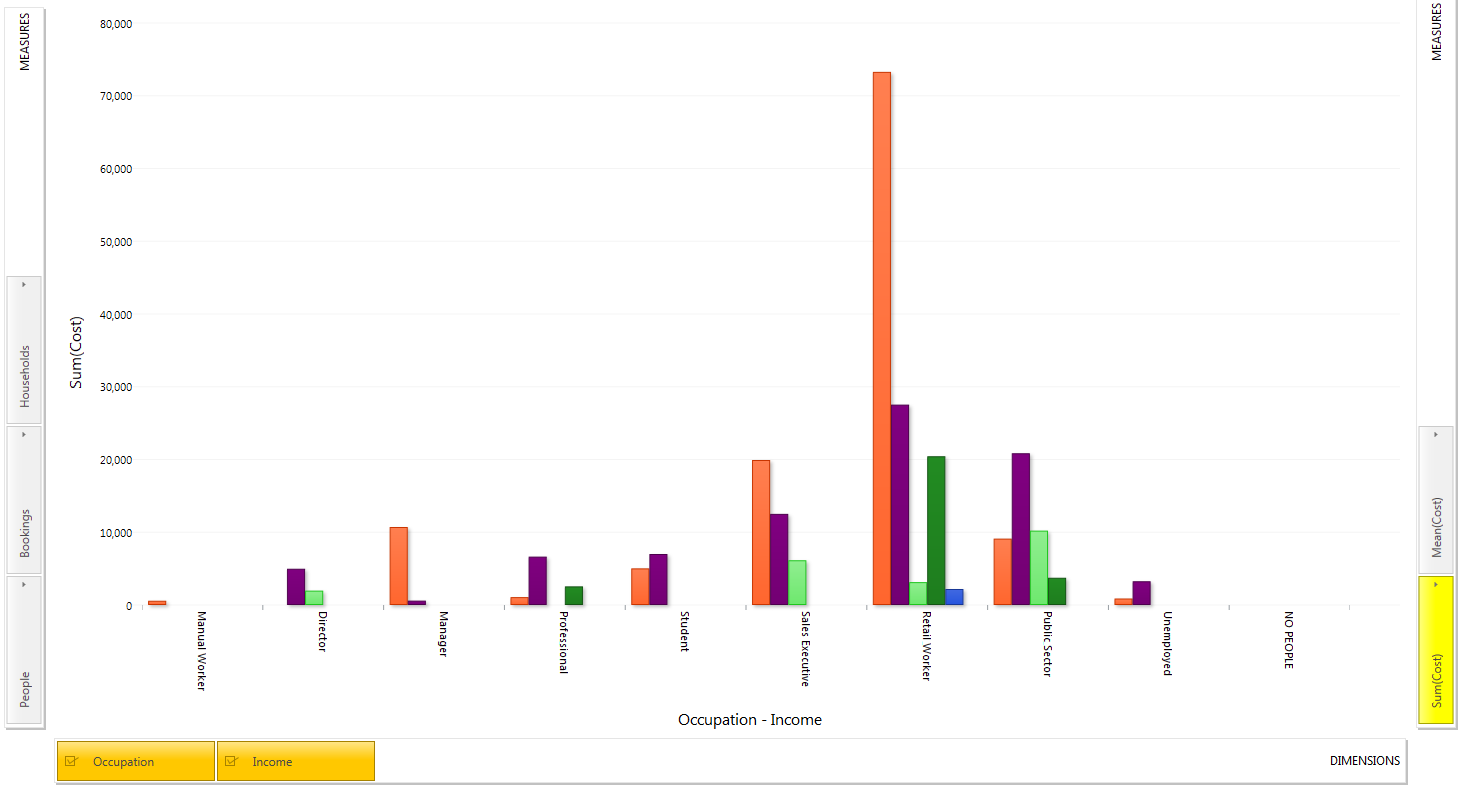
- Left drag the Bookings Cost variable into the middle of the chart to add Sum(Cost) as a measure.
- Repeat but right drag the Bookings Cost variable into the middle of the chart and select Mean(Cost) as a measure.
These measures will appear in the right hand measures bar.
Build to display and then, to switch between any of the measures, simply click on the relevant box.
Note
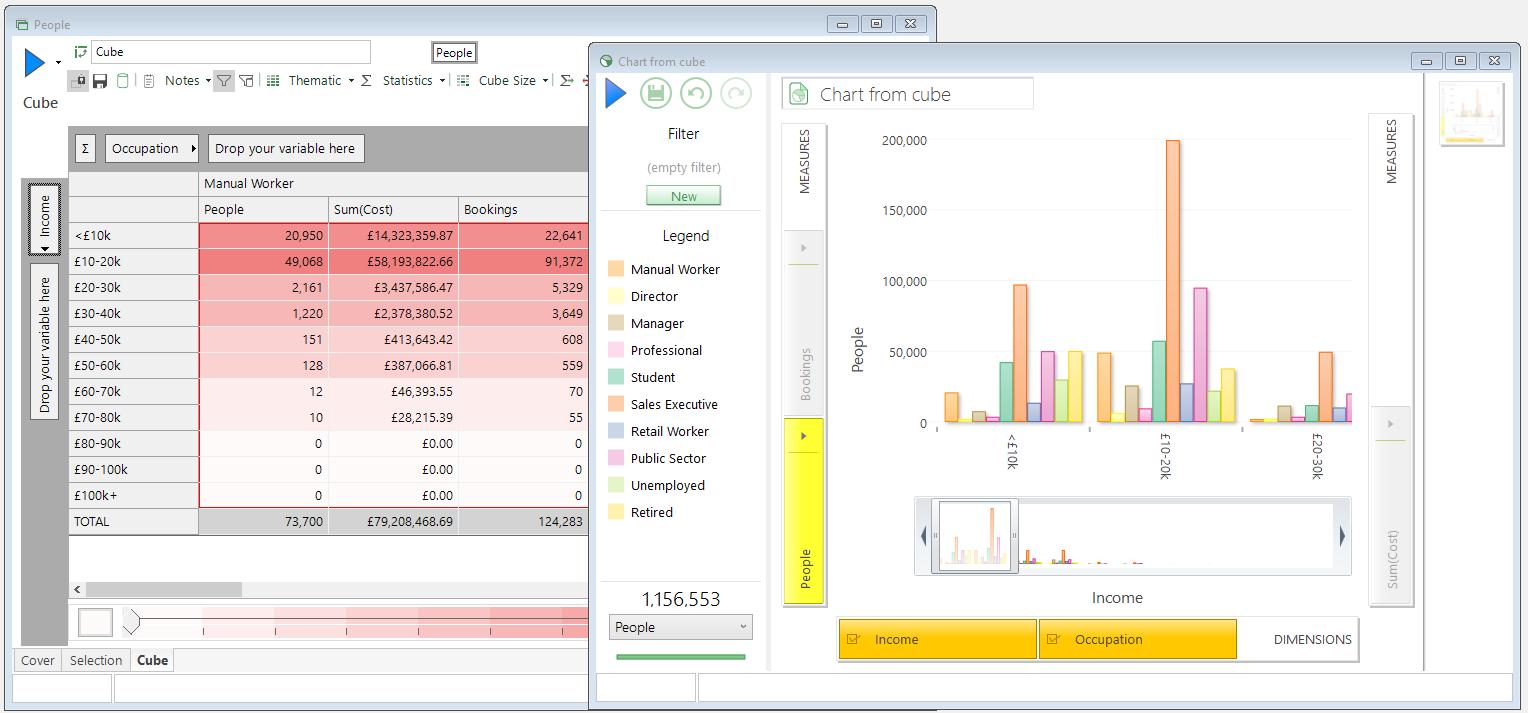
When creating a Chart from a Cube, by default the first measure will correspond to the table level of the Cube from which the Chart has been generated but, where more than one measure is present in the Cube, those measures will also be pulled through into the Measures panel of the Chart for users to select from.
For details of the statistical measures which can be applied see – Use and interpret the different statistics.
When exploring your data from the whole database, drag on the Measure(s) by which you wish to view your data. If none are defined, the Chart will default to the resolve table level from which the first Dimension added to the Chart is derived. This can be switched as necessary.