FastStats release notes 2025
Q4 2025
9 December, 2025
Analysis
Improved Numeric pattern match: relative to Nth transaction
Specifying the relative or percentage difference in a numeric pattern range can now be relative to any previous transaction and not just the one immediately before.
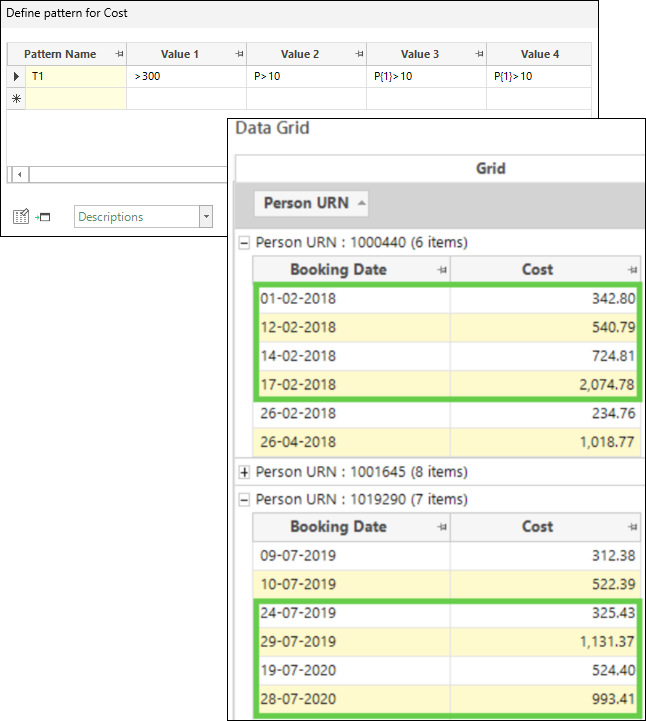
See Expressions: Aggregations on the fly - Pattern Match numeric ranges.
Improved Pattern match ordering values: relative dates
The introduction of relative dates/datetimes as ordering values within pattern match aggregations means you can now, for example, run scheduled tasks, automate campaigns, or examine a person's behaviour around an event, without the need to intervene and manually update the date values.
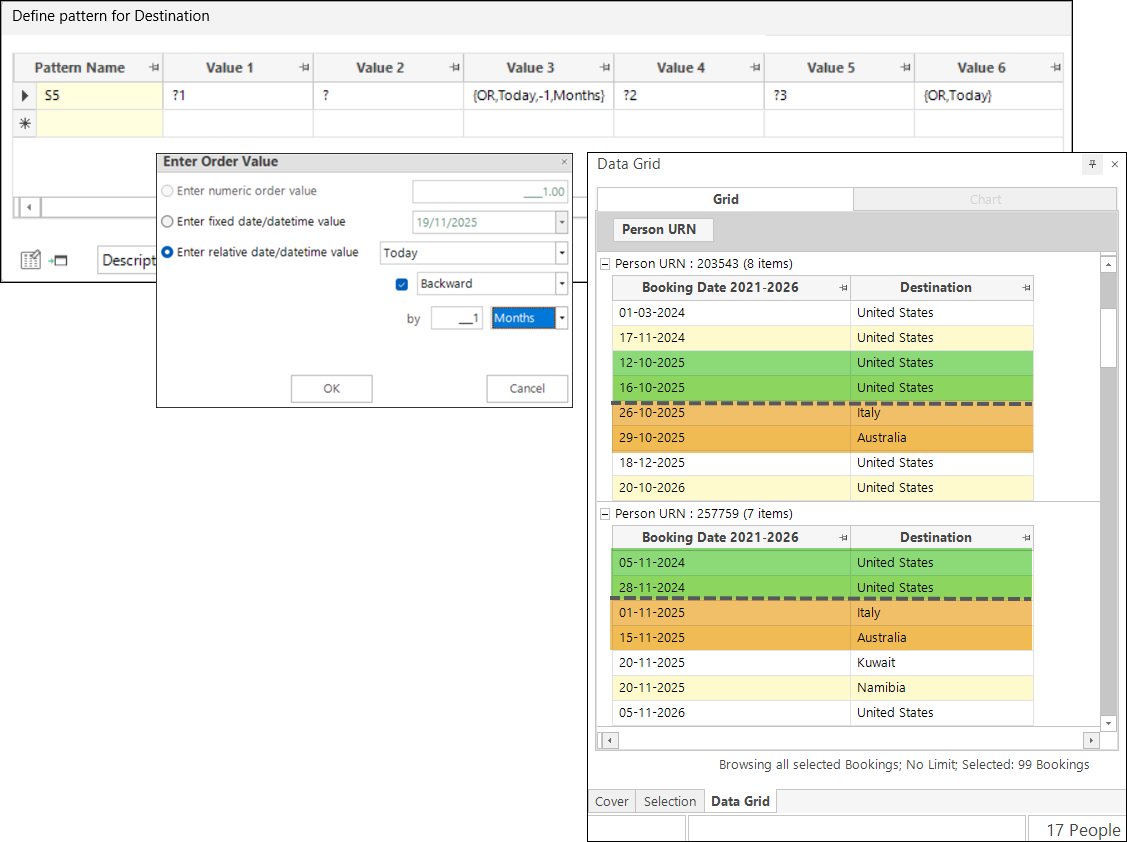
The UI for entering order values is also updated for improved usability.
See Expressions: Aggregations on the fly - Pattern Match ordering values.
Improved Pattern match: minimum days between transactions
Pattern match has long supported a maximum number of days between transactions to ensure that any gap is not too long. Now you can also set a minimum number of days between transactions, making it possible to:
- Define regularity — for example, to search for transactions which are approximately equally spaced.
- Set the minimum and maximum number of days to be equal — for example, to ensure exactly 30 days between transactions.
- Ensure minimum gaps between transactions — for example, not on the same day (Min = 1), at least 90 days after the previous (Min = 90).
See Expressions: Aggregations on the fly - Pattern Match minimum / maximum number of days.
New Linear trend as a value aggregation function
The linear trend calculation is added as a function when creating a value on the fly aggregation expression and allows you to measure a person's transaction value changes over time. This offers greater refinement than the existing rank coefficient function which simply looks at any increase, regardless of size. The linear trend calculation requires you to provide both a numeric and an ordering variable, and the slope of the best fit line through the transaction values is returned as a positive or negative value.
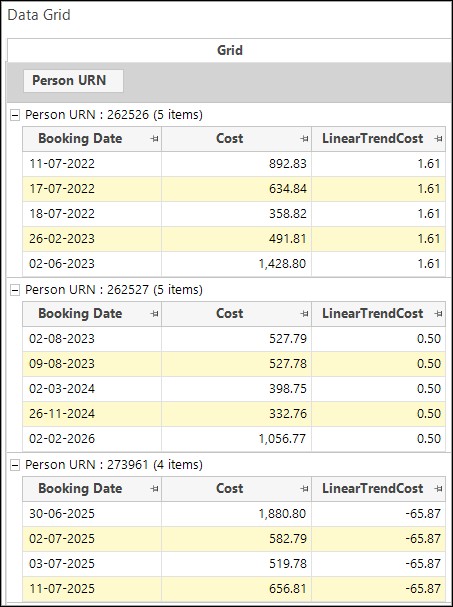
See Expressions: Aggregations on the fly - Value.
Improved Relative aggregations: grouping variable
Instead of optionally using a 3rd transaction variable as a secondary sorting variable, you can use it as a grouping variable, and then return the relative aggregation from within each group.
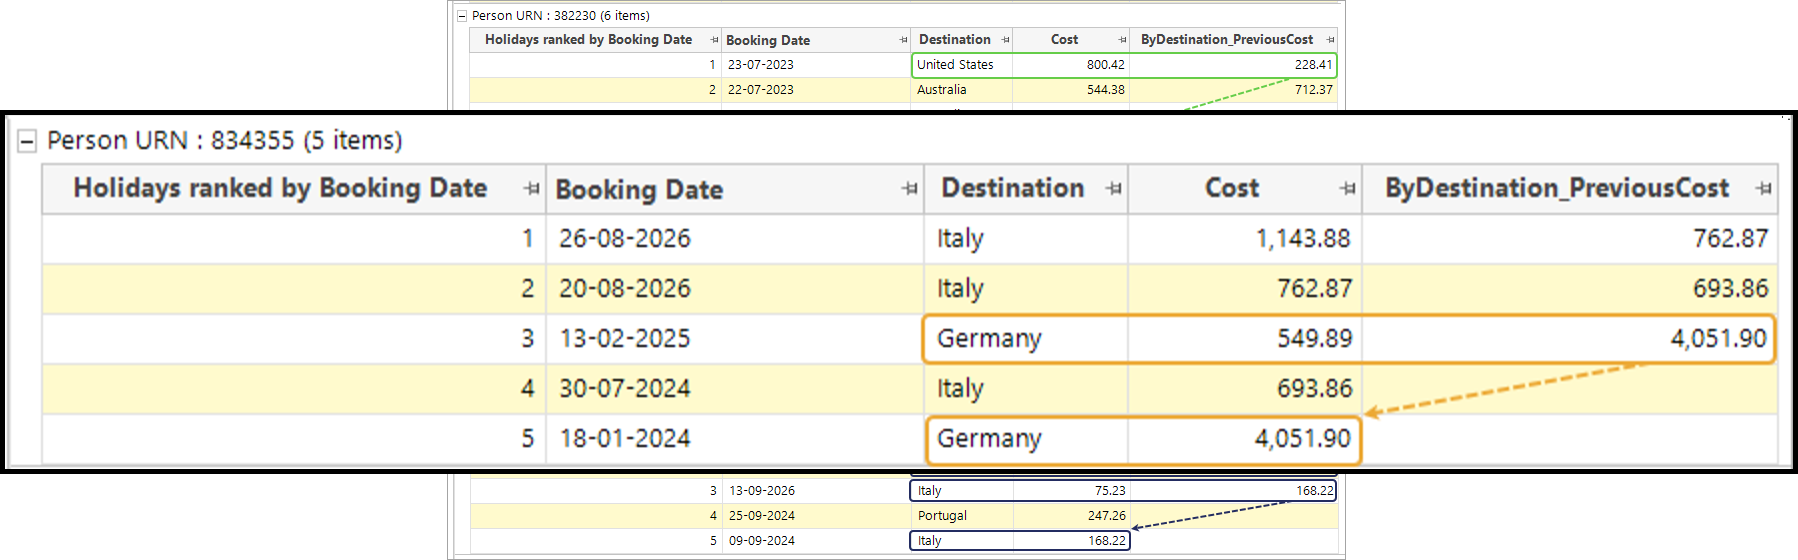
See Expressions: Aggregations on the fly - Relative Transaction.
Improved Running and rolling aggregations: grouping variable
The power of running and rolling on the fly aggregations is extended so that you can optionally group a person's transactions by the categories within a selector variable. For example, display the running total cost spent by an individual, grouped by the different destinations they have visited.
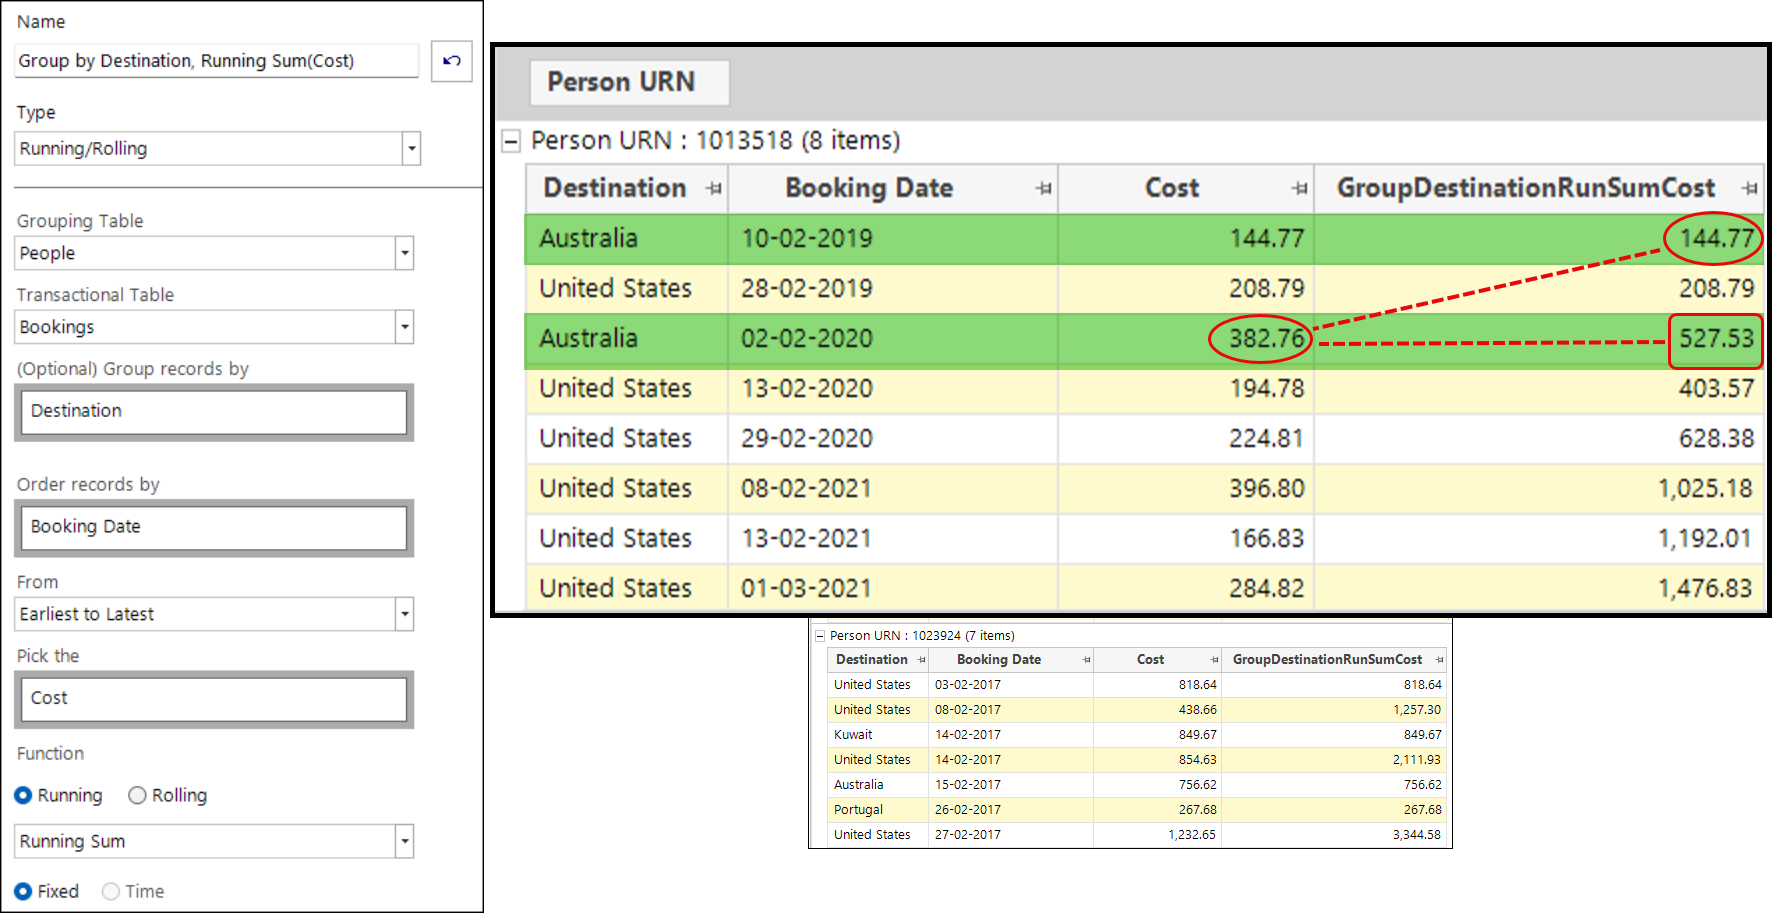
Grouping is supported for running, rolling across a fixed number of transactions, and rolling across a time period. The results within each group start from the first transaction.
See Expressions: Aggregations on the fly - Running and Rolling.
Improved Transaction Analysis wizard: improved drag-off
The Transaction Analysis wizard helps you to find common sequences of transactions in your data from which you can drag and drop results to create a FastStats selection. Historically this has been achieved using relative aggregations but now pattern match aggregations power the process and resulting selections can run N times faster, where N equals the number of elements in your transaction analysis.
New New expression functions
Two new functions that allow you to convert from a string into a date or datetime data type are introduced — StringToDate and StringToDateTime.
Improved Expression return type improvements
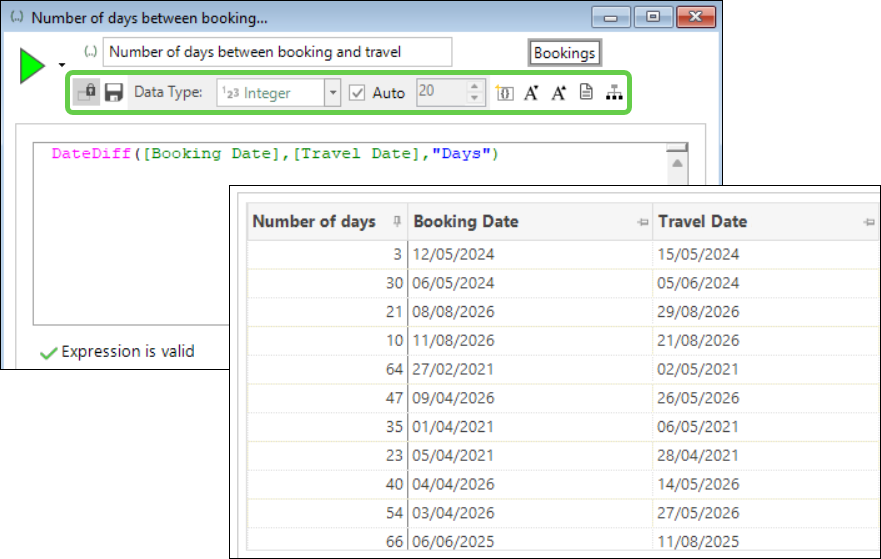
When you create an expression, by default FastStats looks at the expression syntax and automatically detects and returns the type of expression — decimal, integer, text, date, or datetime. The 'auto' capabilities have been improved for even greater accuracy, while still giving you the option to override and set the type manually when needed.
New Customisable expression colours
There are six default colours used to distinguish the constituent parts of an expression but you can now customise these colours to suit your own preferences. Simply head to File → Tools → Options → Expression to choose your palette.
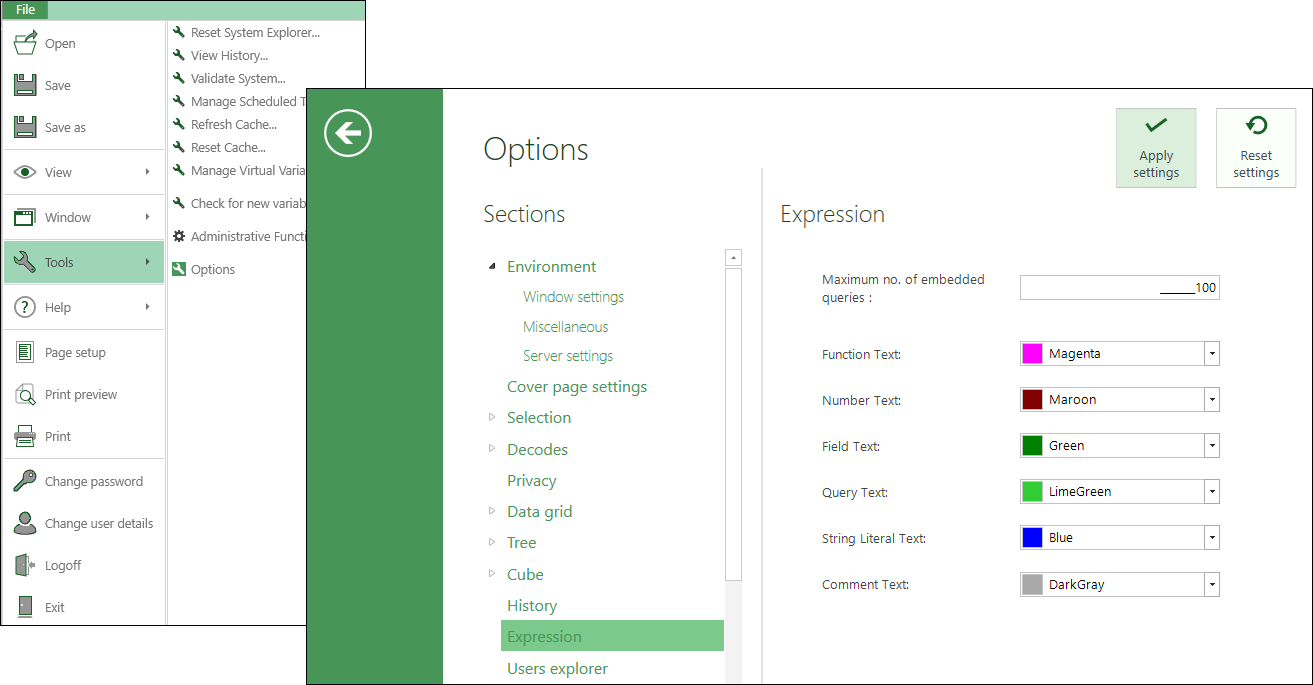
Once set, the personalised colours apply to any new expressions you create.
System improvements
Improved Query engine optimisation
Query optimisations introduced in Q3 2025 remain disabled by default in this release (optimisation level 0). To enable them, set the Query optimisation level in FastStats Service Configuration.
Improved Cache refresh: cube entries supported
The FastStats Service now automatically refreshes both query and cube cache entries in the background. The service processes multiple cache entries simultaneously on a low-priority thread, ensuring your cache remains up to date regardless of system load.
Note
The multi-threaded refresh mode is enabled by default. You can revert to the legacy single-threaded, query-only mode if needed.
Configurator improvements
Improved Automatic crash dump configuration
The FastStats Configurator now automatically configures crash dumps for the FastStats Service when it starts. If crash dumps aren't already configured, the Configurator creates default registry settings to collect up to 10 mini-dumps.
Note
The Configurator only creates crash dump settings if they don't already exist for the FastStats Service and global crash dumps aren't enabled. If you've already configured crash dumps, your existing settings remain unchanged.
Improved Machine-level default install location
The default FastStats Service installation location is now stored at machine level in %ProgramData%, ensuring all administrators share the same default installation path.
Bug fixes
- Wizards and virtual variables
- Fixed issues related to the Transaction Analysis wizard
- Bug relating to the drag-off of multiple values
- Disallow dedupe and days between transactions
- Disallow option for dedupe and occurrences in the UI
- Incorrect drag-off from occurrences
- Fixed issues related to the Transaction Analysis wizard
- Expressions
- RankCoefficient: fixed an issue of incorrect calculation when there are missing date values.
- Running/Rolling aggregation - fixed:
- A UI issue on particular numeric controls in the on the fly dialogue window
- Rolling count not being remembered after editing.
- Fixed a parser issue with DateDiff and If expressions.
Q3 2025
25 September, 2025
Analysis
New Ordering values in pattern match
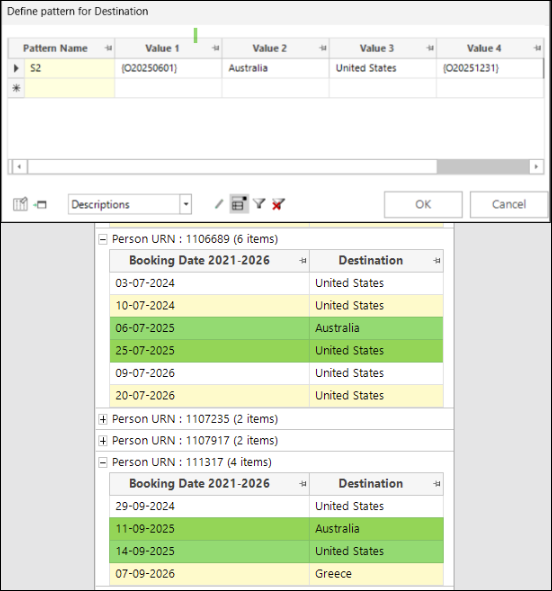
The latest extension to on the fly Pattern Match aggregation allows you to search and return transactions where particular parts of a pattern fall into particular time periods. This type of analysis is useful, for example, to select people based on their behaviour in time windows leading up to an event, such as a campaign, their behaviour after such a campaign, as well as behaviour within specific time points.
The new development is supported for selector, numeric and selector/numeric pattern types; you enter a date/datetime/numeric as an ordering value within the pattern. All existing pattern matching functionality is supported, including wildcards, return values, filter selections, and include/exclude lists.
See Expressions: Aggregations on the fly - Pattern Match ordering values.
New Pattern match: longest all different
When creating pattern match aggregations using selector variables, a new, pre-defined pattern match type allows you to search for the 'longest all different' sequence of categories.
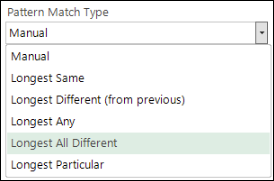
See Expressions: Aggregations on the fly - Pattern Match.
New New rolling count function
When creating rolling on the fly aggregations, you can now return a 'rolling count' of transactions going backwards within a time window. This allows you to answer questions such as, for example, from a particular transaction, how many transactions were there in the previous year.
See Expressions: Aggregations on the fly - Running and Rolling.
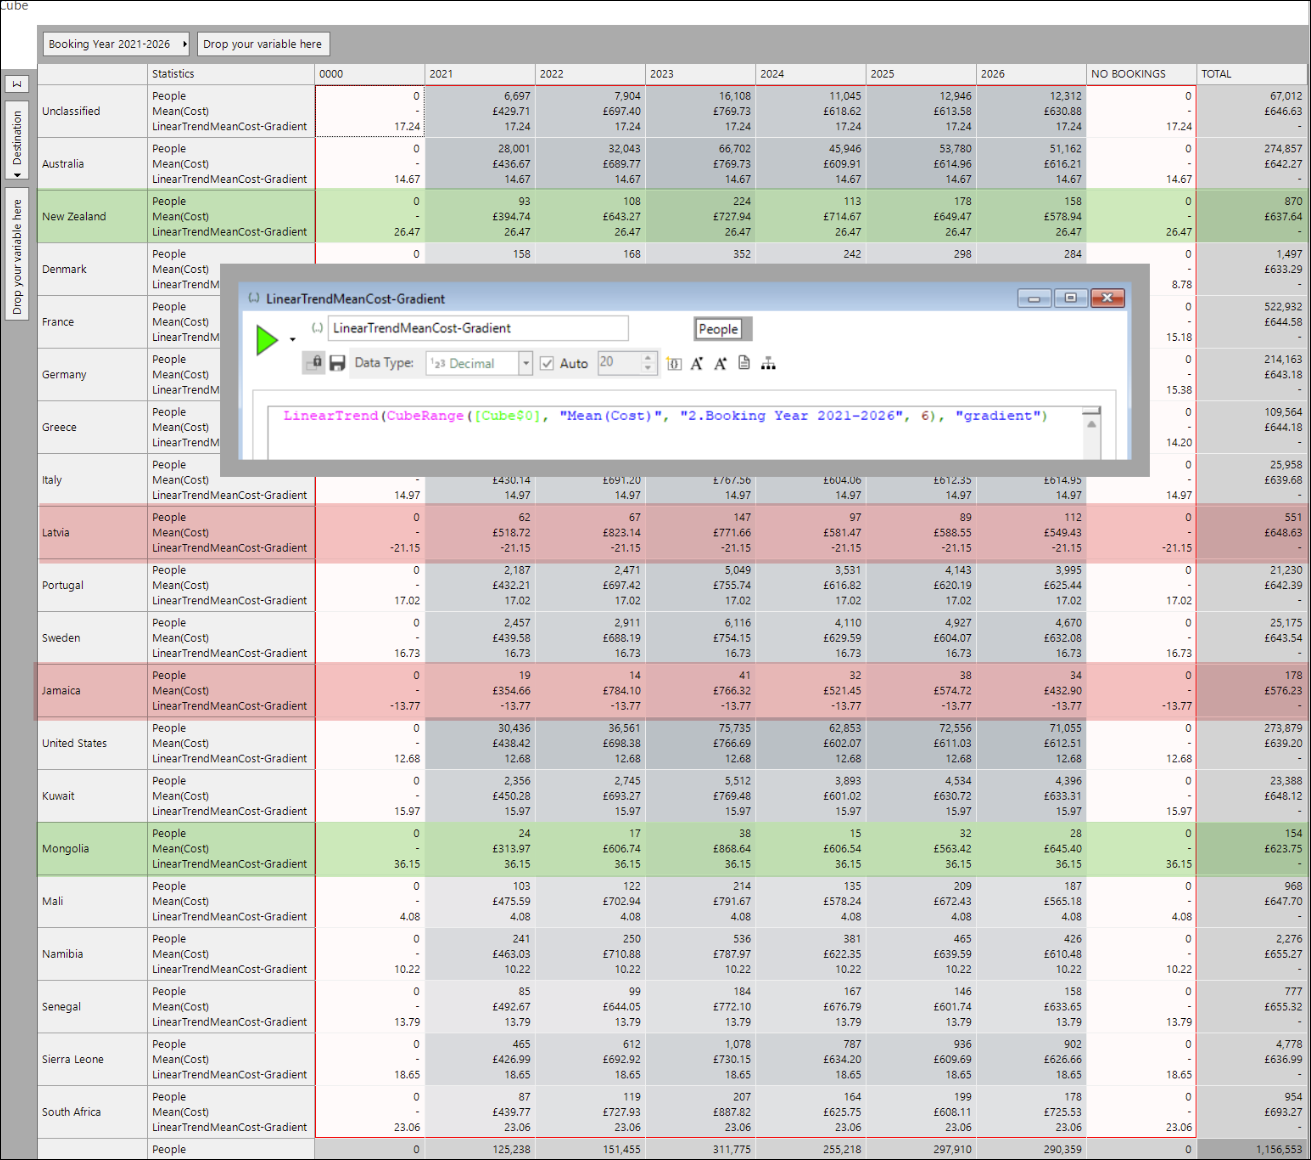
New LinearTrend list expression function
Linear trends allow you to examine increases and decreases over time — for example, to see which of your products are becoming more or less popular, or perhaps gaining or losing value.
The LinearTrend list function calculates the linear trend across two lists of numbers and is particularly useful when working with cube derived expressions and lists of values — often used to look across a date dimension and individual product categories in a cube.
The cube below demonstrates use of the LinearTrend function to examine the increases or decreases in the average cost of bookings to different destinations over a period of six years. Highlighted in red, Latvia and Jamaica are the only two destinations that show a decrease in average cost over time. In green, New Zealand and Mongolia are the highest increasing destinations.
See Expressions: List Functions.
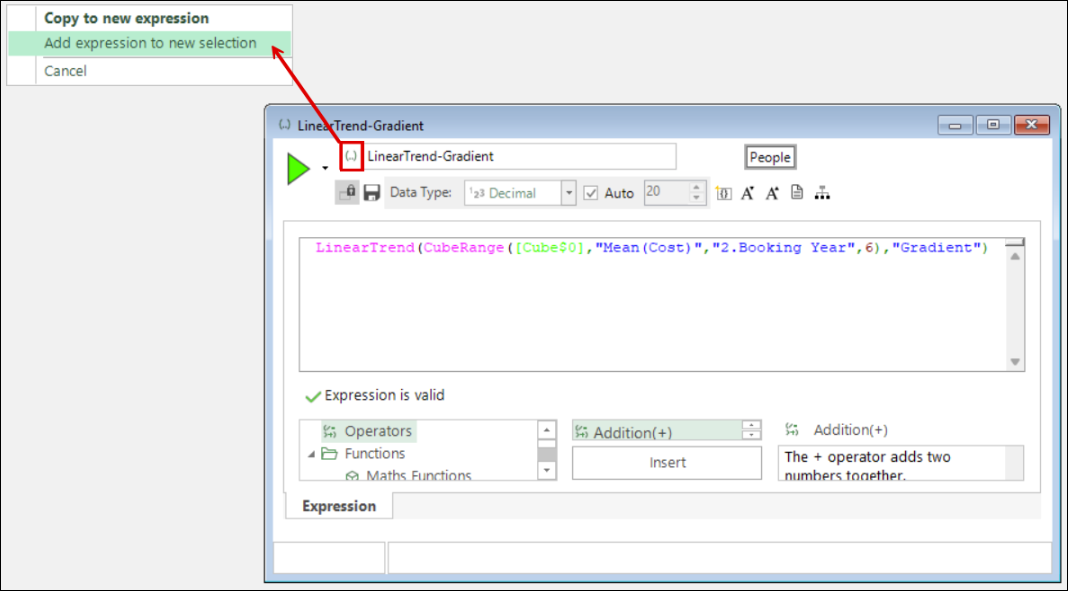
Improved Expression-to-selection drag
Adding an expression into a new selection is simplified so that you now just right drag the expression onto your FastStats workspace and select 'Add expression to new selection' from the context menu.
New Profile model wizard: custom codes and descriptions
In the PWE wizard, category descriptions have always been determined automatically. Whilst this remains the default, you can now specify your own custom codes and descriptions for the case when there are *N* bands in the created variable. This is not possible if you choose the size of each band.
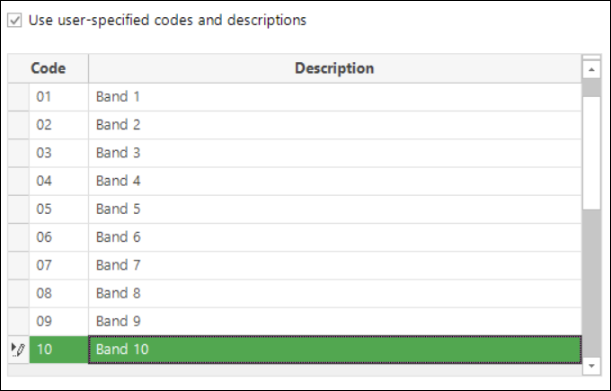
See Profile model wizard: Codes and descriptions.
Improved Point to Point wizard: description override
For the Point to Point wizard, in the case where you create a single variable from multiple centre points using a centre point file that has optional descriptions, those descriptions are displayed.
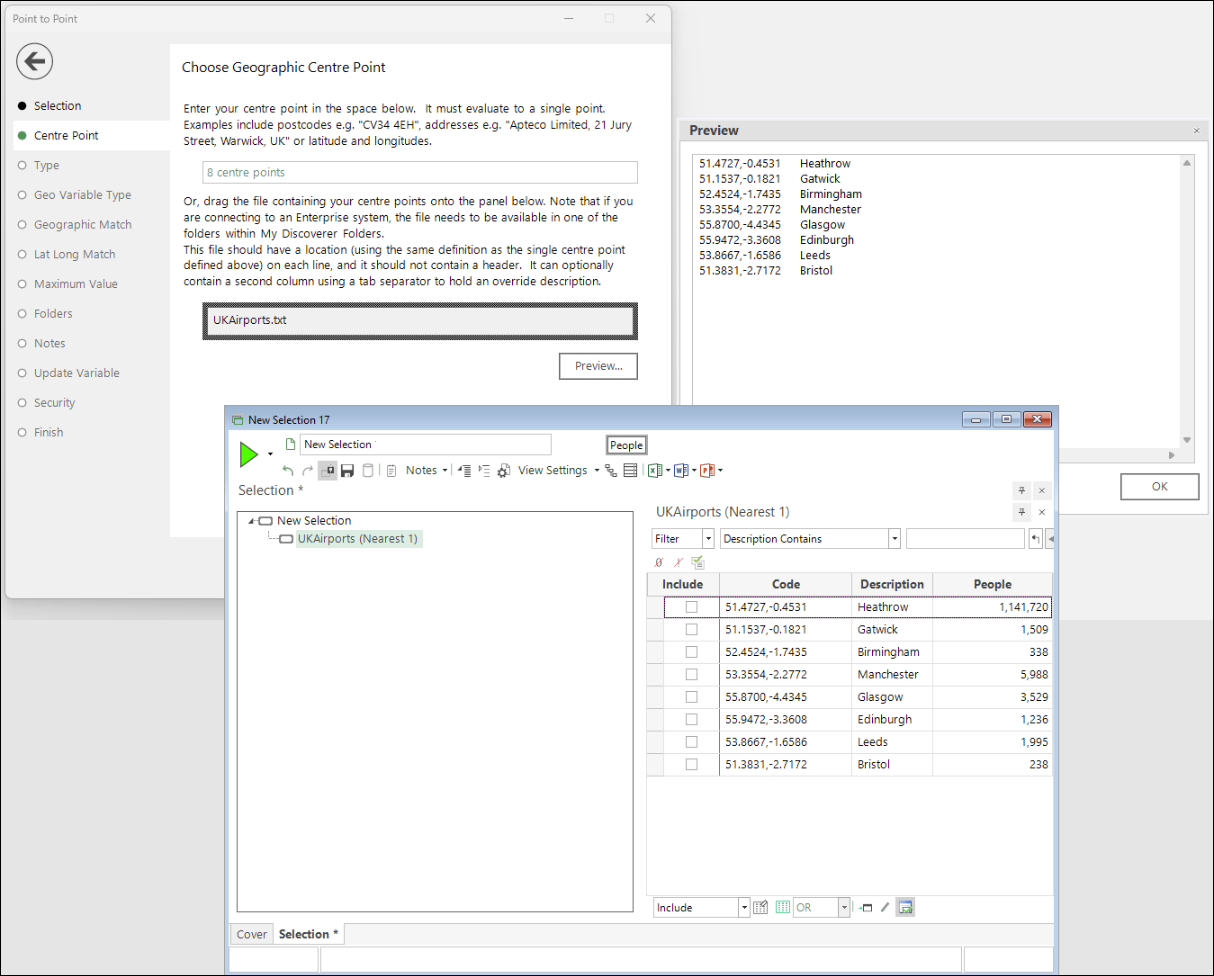
The example above demonstrates this for a 'nearest drivetime' virtual variable with 8 centre points, generated from a file containing the latitude and longitude co-ordinates for the location and name of eight UK airports. The airport name is now used in each variable category description instead of the location.
Modelling
New Behavioural modelling templates
Preparatory work has begun for behavioural modelling templates to become available and usable in Apteco Orbit. In the interim, confident users of behavioural modelling can access and benefit from this work through the FastStats Modelling Environment. Please note that the functionality and user interface in this first release are subject to ongoing development which will be made available in future software releases.
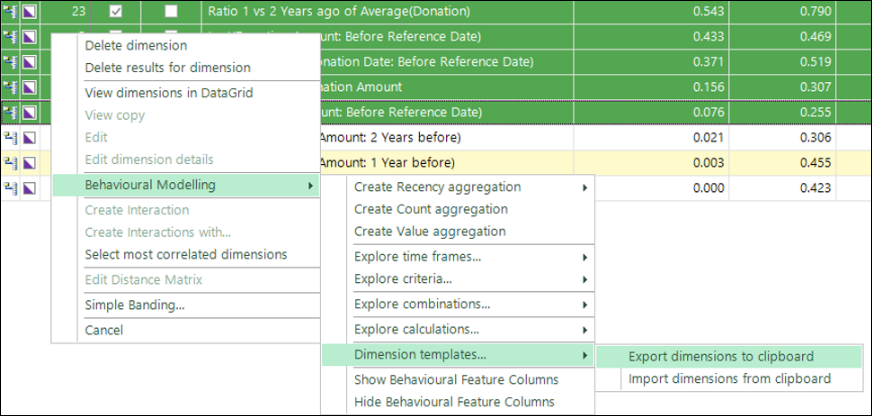
See Behavioural modelling — templates.
System improvements
New Query engine optimisation
We're working on a long-term project to optimise the performance of the FastStats query engine. The Q3 2025 release includes the first batch of these optimisations.
The following selection types are optimised under certain conditions:
- Selector based (including Primary selectors) queries on single and multiple table queries including support for queries using base and Global Filters
- Numeric variable (stored as 4 bytes) queries on single table queries and multiple table queries including support for queries using base and Global Filters
- Single table select all records queries including support for base and Global Filters
- String selections on single table queries and multiple table queries including support for queries using base or global filters
These optimisations apply to queries that don't have a left join between tables, and are not Nper, TopN, RFV queries, or have implicit Single Parent Lookups.
Example performance improvements over Q2 2025:
- Selections: 40% improvement for Selector based selections on single tables; 30% improvement for Selector based selections on multiple table queries
- Numeric: 60% improvement on single table queries that use a numeric selection
- Text: 50% on 'Begins with'; 25% on other text comparisons on single tables
Note
These optimisations are disabled by default in the Q3 2025 release. To enable them, set the Query optimisation level to 1 in FastStats Service Configuration.
Bug fixes
- Data Grid
- Data grid right-click option for array variables, selected codes only didn't produce a valid expression.
- Expressions
- Parser error message for aggregation of Longest Particular wrong.
- Edit an expression column from right-drag flag array isn't valid.
- Pattern Match Aggregations — shouldn't be able to pin columns in pattern.
- Expression of integer type can't be turned into a selector VV — should not be allowed.
- Pattern Match Manual pattern UI — no tooltips on buttons.
- Wizards and virtual variables
- P2P wizard — Description override doesn't work for single variable case.
- Nonsensical currency options in create VV.
- Selections
- Can save an uncountable query — warn user in this case.
For administrators
The new query engine optimisations introduced in this release are disabled by default. To enable them, set the Query optimisation level to 1 in FastStats Service Configuration. See Query engine optimisation for details on which selection types are affected and the expected performance improvements.
Q2 2025
16 May, 2025
Analysis
New Penetration maps: statistically significant results
Based on the capabilities of the Profile tool, penetration mapping provides valuable insight by allowing you to compare two groups of people on a map using an analysis to base index measure. Now it's possible to refine your analysis further and display results which, based on their Z-score, are statistically significant. You can choose to:
- Display only statistically significant categories when applying shading based on the Index measure.
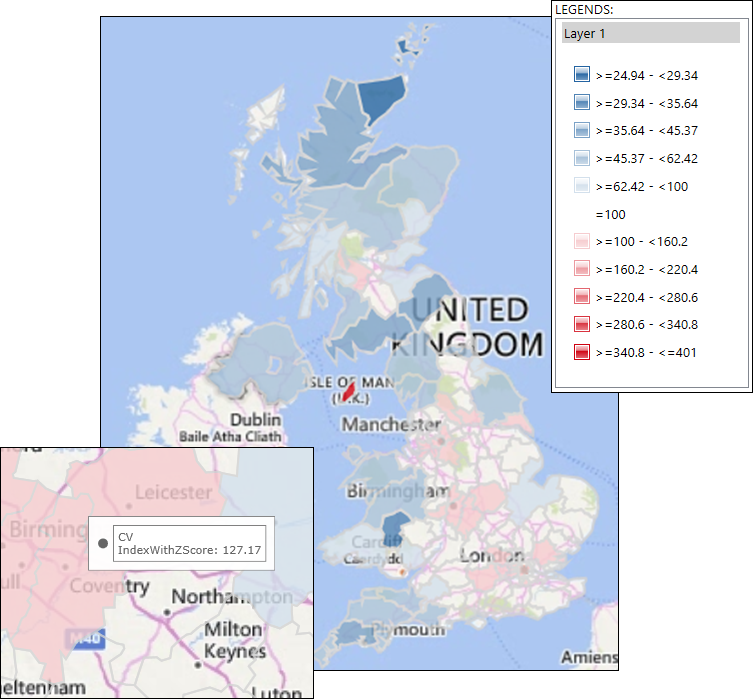
- Set your penetration map to display statistically significant areas based on actual Z-scores.
- Apply Z-score thematic shading to the map.
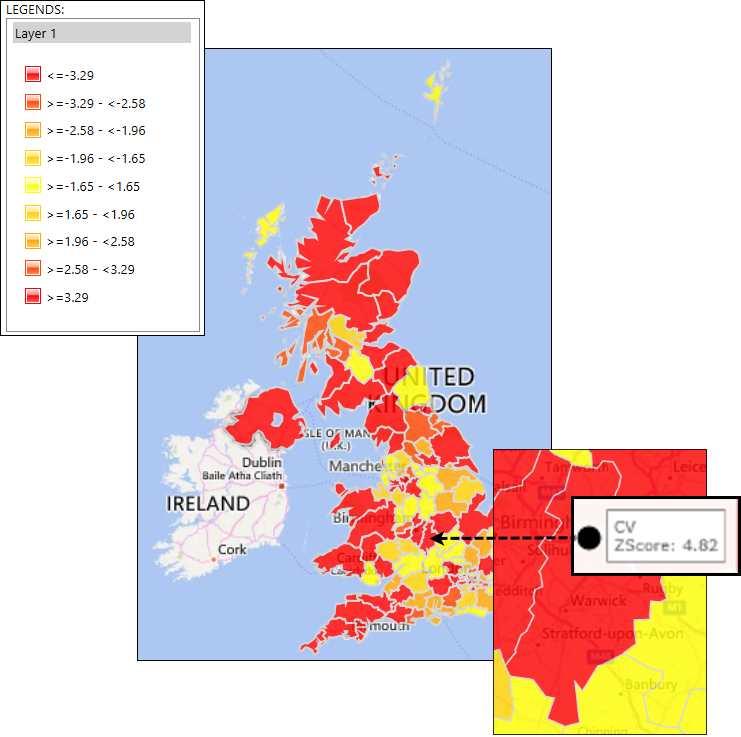
See Bing Maps: Penetration Mapping with Z-Scores.
New Pattern match: category grouping
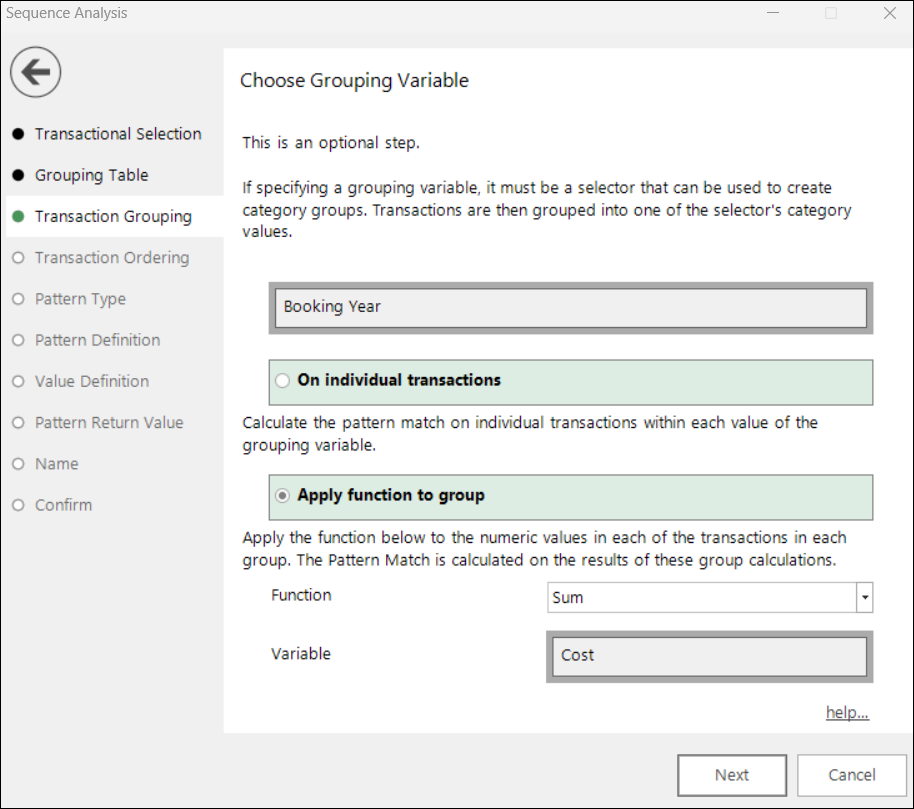
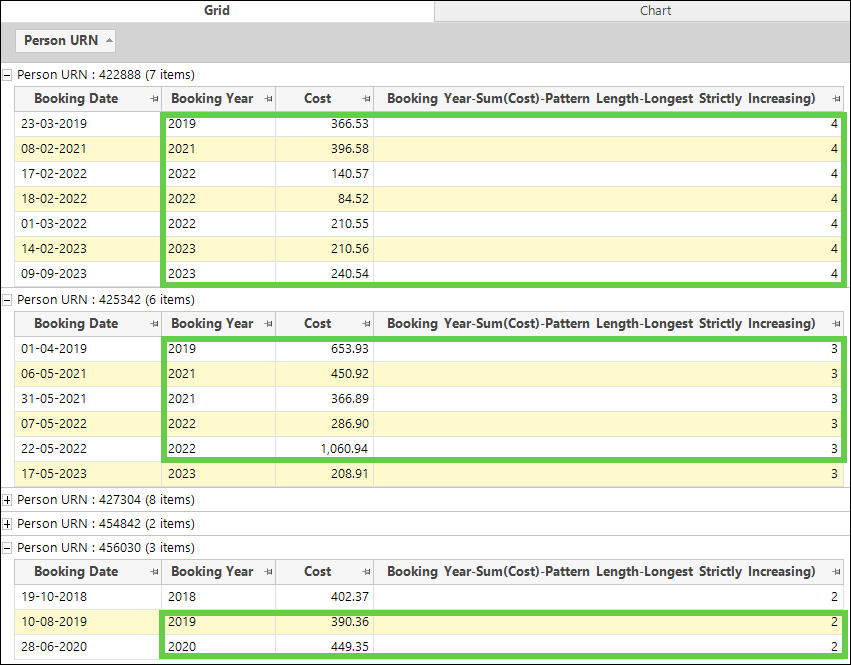
Pattern matching provides a powerful way to analyse sequences of transactions but, when discerning patterns at the individual transaction level is not possible or desirable, the power of Category Grouping and Pattern Match aggregation techniques are now combined and allow you to:
- Use an ordinal selector variable, such as booking or donation year, to group transactions.
- Apply a numeric function, such as the sum of the cost or gift, to all the transactions in each group.
- Use the resultant list of years and numeric values as the input for pattern matching where you might then, for example, look for the longest sequence of years where a person's holiday costs or donation values have increased.
You can carry out this analysis by creating an on the fly aggregation directly within the Expression editor or, alternatively, follow the steps of the Sequence Analysis wizard to generate the expression.
See Expressions: Aggregations on the fly - Category Grouping with Pattern Match.
New Pattern match: start and end wildcards
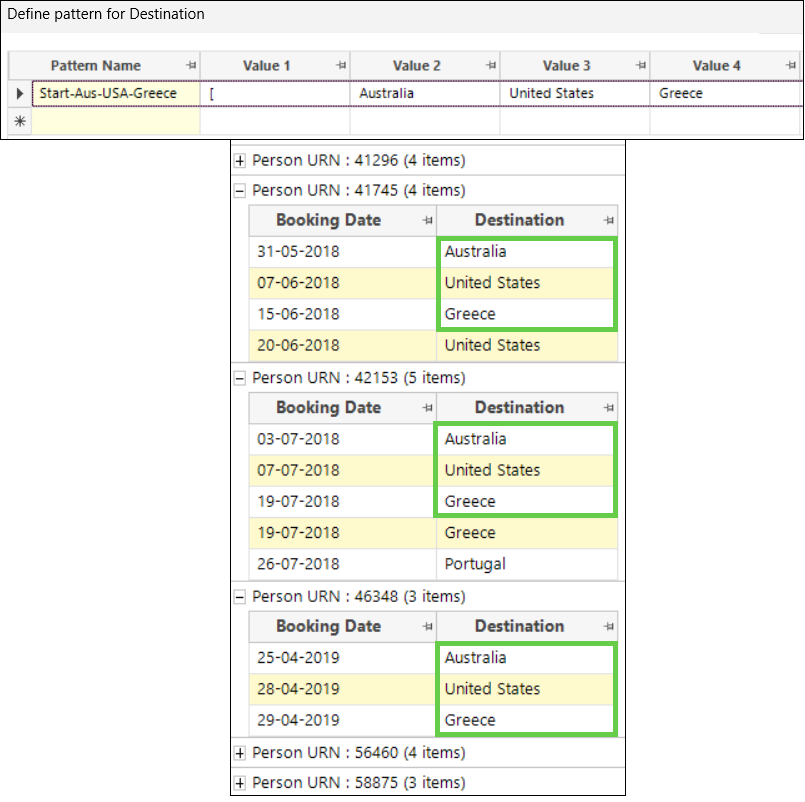
Understanding how a new customer started transacting, or examining someone's latest purchases, is valuable insight. Though previously possible, such analysis is now significantly easier and more accessible with the introduction of [ and ] as wildcards to use when manually defining patterns of interest. They allow you to anchor a pattern to the start or end of the transactions you're analysing or, in some cases, you might choose to use both to identify people whose whole sequence of transactions matches the specified pattern.
See Expressions: Aggregations on the fly - Pattern Match positional wildcards.
New Transaction Analysis wizard: de-duplication
The Transaction Analysis wizard allows you to examine patterns of transactional data and identify common sequences of transactions — such as, the most popular patterns of holiday destinations visited. A new option in the Pick Transaction Variable step means you can optionally de-duplicate and remove all direct repetitions, reducing a pattern to a single sequence which, for example, allows you more easily to see switches between products.

See Transaction Analysis wizard.
New Relative aggregations: de-duplication
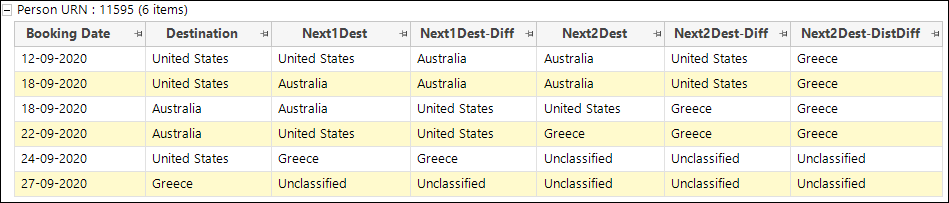
Two new features are available for Next aggregations when creating Relative Transaction on the fly expressions, providing the ability to de-duplicate and remove repetitions. You can select:
- No deduping (default): Next N returns the Nth record after this one.
- Different: Next N returns the Nth record after this one once direct repeats are deduplicated and removed.
- Distinctly Different: Next N returns the Nth distinctly different record after this one.
See Expressions: Aggregations on the fly - Relative Transaction.
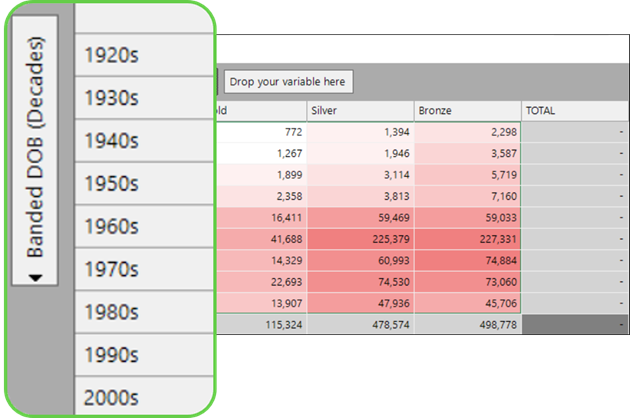
New Date banding by decade
You can now band date and datetime variables and expressions into decades for use in a:
- Cube: As a dimension
- Data grids: As a column
- Selection: As an ad hoc date option
This new option is useful when working with a date variable that has a large range. Full support also extends to include the PeriodToDate and Comparison functions within calculated measures, as well as the equivalent expressions for derived cubes and PeriodToDateCubeRange, which all now support decade banding.
Improved N% per expression support
The ability to sample N% of records whilst maintaining distribution across a selected variable is extended to include distribution across a selected expression.
See Selection: How do I make an N% per variable or expression selection?
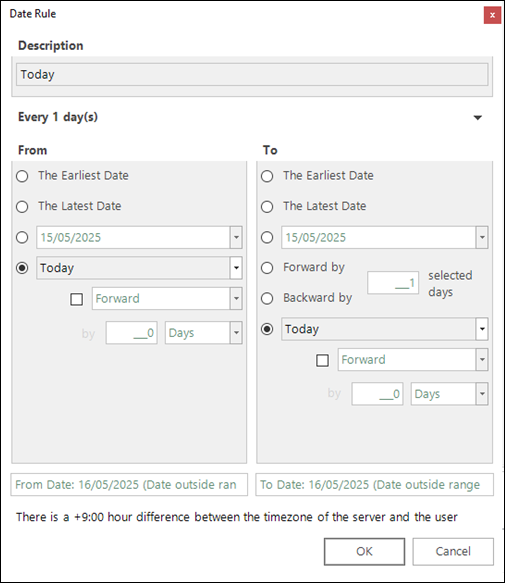
Improved Timezone updates
We've updated how time zones are aligned across FastStats server and user locations. This means that when making a selection with a date or datetime variable, the time zone displayed reflects the server/system location, rather than your location.
Bug fixes
- Expressions
- Fixed an issue in numeric Pattern Match where the Include List/Exclude List button is visible but has no effect.
- Fixed an issue when the right drag of a flag array to a data grid column results in an error in the size of the expression.
- Fixed an issue on German systems where an expression with a decimal separator comma fails to build when dragged onto a cube.
- Cubes
- Fixed an issue on German systems where expressions used as measures have decimal errors.
- Fixed an issue with calculated measures where the periodtodate form has invalid entries in the date period list.
- Fixed a bug with switching to the Index thematic when the data is not suitable.
- Date / DateTime variables
- Fixed an issue where the pen/edit icon is visible within the date rule dialogue.
- Wizards
- Fixed an issue where Transaction Analysis drag-offs returned incorrect First/Last selections and results.
For administrators
File format change in FastSTats Service
We’ve changed the format of the .fsDat files (full and partial) to include a header.
This change improves the FastStats service start up speed when there are a large number of partial indexes and to link the .fsDat files to the .vie file for improved safety.
Note
This change means that:
- You'll not be able to open FastStats systems built with 2025 Q2 in earlier versions of FastStats.
- You'll still be able to open FastStats systems built with earlier versions in 2025 Q2.
Automatic maintenance for the job queue
We've added automatic maintenance options for the job queue. This improvement to the FastStats Service minimises the data stored in the web server database. Apteco systems use a central job queue database that stores the questions and results from user activity within the system — this builds up over time.
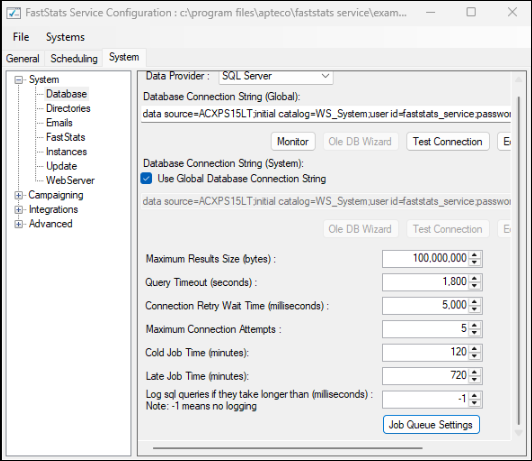
Administrators can now set retention policies for items in the job queue directly, without creating custom maintenance mechanisms.
Q1 2025
13 February, 2025
Analysis
Improved Support for extended text fields
We've increased the maximum size of a text field from 255 to 32767 characters. This means you can now load larger amounts of text into your Apteco system via Designer, and existing FastStats analytics are extended to accommodate strings up to the new limit. This includes, for example, selections using text variables, text or shredded text analysis in cubes and cube-based visualisations, the ability to display large text fields in a data grid, and expressions which take string parameters or return strings.
Examples of extended text fields include data from customer reviews and feedback, and social media posts.
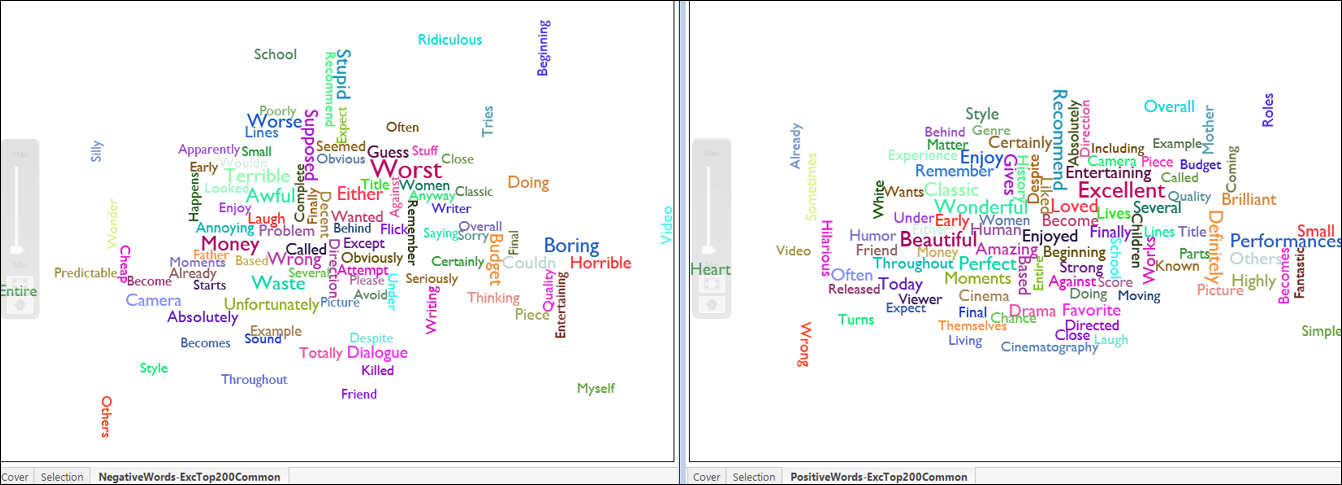
The maximum text field size must be determined in Designer by your system administrator.
See the Designer Q1 2025 software release.
New Data grid: cell contents preview
With the introduction of support for extended text fields, we have also made it possible for you to preview such content via a new, right-click menu option in the data grid tool.
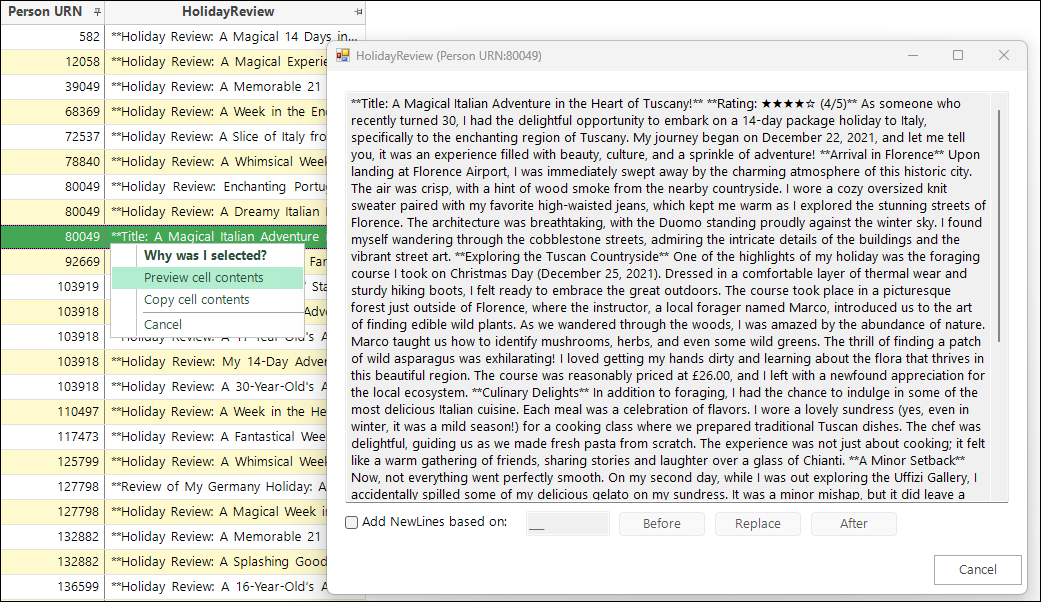
For those with permission to do so, the text can also be copied from the preview window.
Key benefits include the ability to:
- Easily read large text fields, such as customer reviews or complaints.
- Extract sections of text if preparing a response email.
- Copy out and summarise content in ChatGPT.
- Copy out and include examples in a report.
As part of the Enhanced Build process in Designer, characters used for formatting the original text are removed for performance reasons. Pre-processing the data is possible, but formatting options are provided in the user interface to make the text more readable by inserting line breaks, if necessary.

See Data grid - how do I preview cell contents?
New New cube measures
Three new statistics are now available for cube-based analysis using cubes, trees, segmentations, Venn diagrams, as well as variables and expressions.
- Range(variable or expression) — returns the difference between the maximum and minimum values of the variable.
- NthBiggest(variable or expression) — takes all the values in a cell in the cube, sorts them into order, and returns a particular Nth value from the top of the list.
- NthSmallest(variable or expression) — takes all the values in a cell in the cube, sorts them into order and returns a particular Nth value from the bottom of the list.
The introduction of the Range statistic removes the previous need to create a calculated measure to display this information. NthBiggest and NthSmallest are useful in cases where there are a small number of outliers that would skew a maximum statistic, or where there are a small number of values in a cell and a percentile measure isn't adequate.
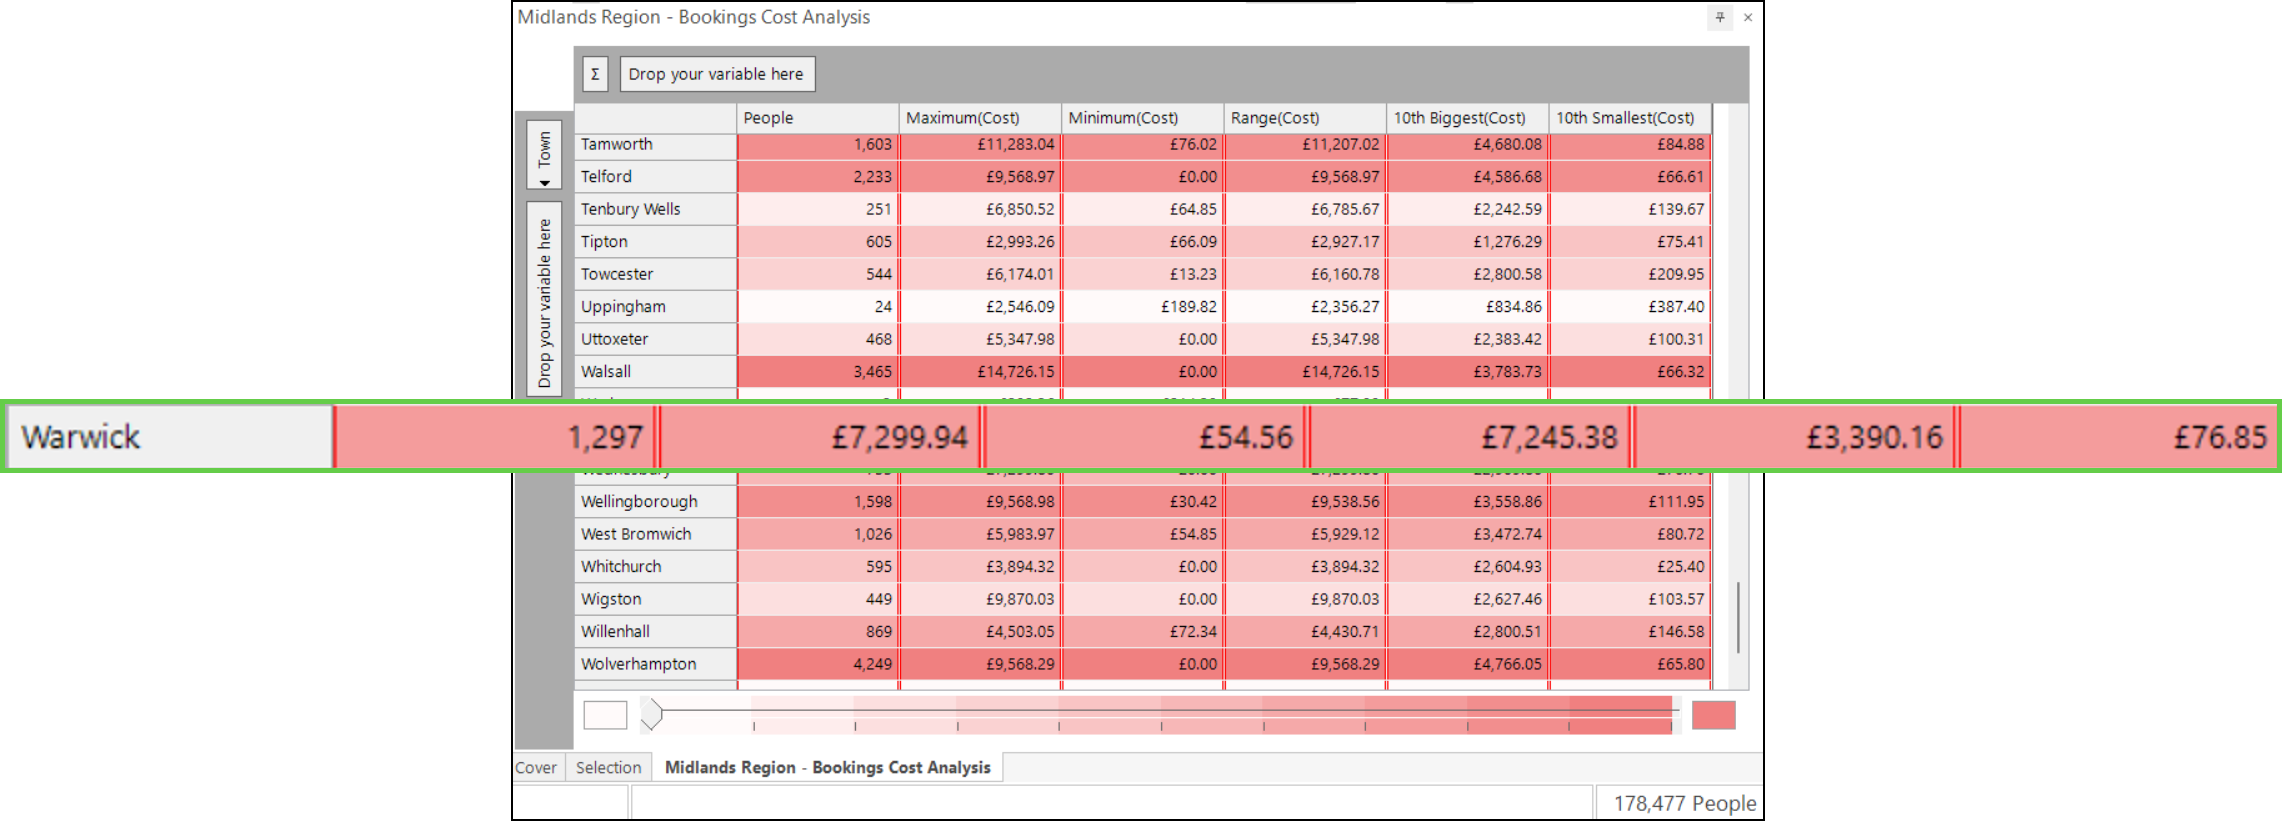
See How do I include statistics on a cube?
Improved Numeric pattern match extensions
We have added to the range and power of numeric pattern match analysis with three new capabilities:
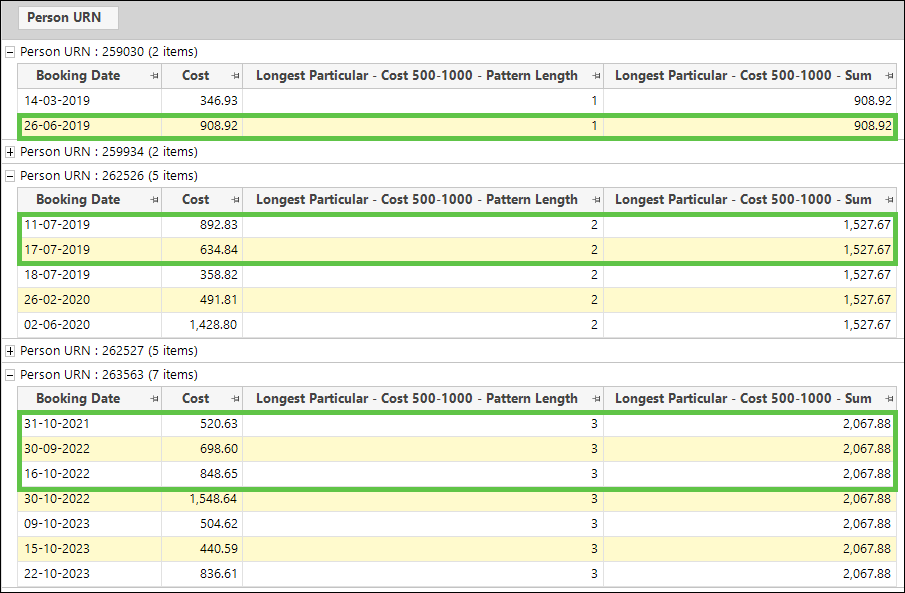
- Longest Particular (Range)
You can search for a 'longest particular' sequence where the particular value is a numeric range. This makes it possible to answer questions such as, what is the longest sequence of transactions a person has made where all of those transactions fall into a cost range between £500–1000.
- Include/Exclude ranges
You now have the ability to select a set of numeric ranges for an include or exclude list allowing you, for example, to find the longest sequence of transactions a person has made, excluding any that cost less than £1000 or more than £2000.
- New sum and mean properties of numeric sequences
You can set a return value as the sum or mean of the numeric values in the matched pattern allowing you, for example, to find the total cost of transactions captured by your defined sequence.
The new settings are accessible in the user interface through the numeric Pattern Match aggregation dialogue, or the relevant Sequence Analysis wizard steps.
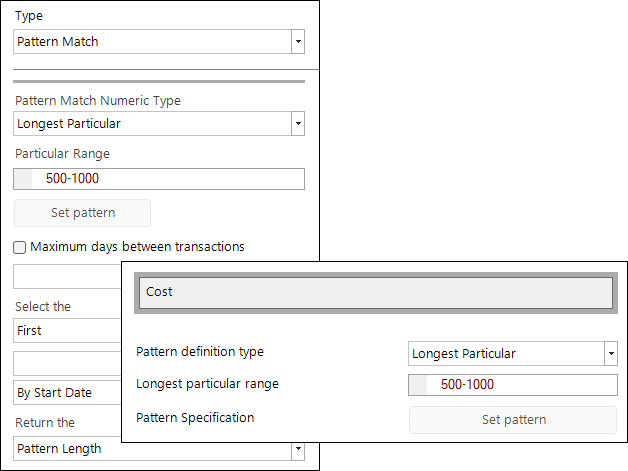
See Aggregations on the fly — Pattern Match Numeric Longest Particular and Pattern Match Include or Exclude list
New Copy expression into another
You can now drag one expression into another using its drag handle. This copies all of the expression text to the insertion position of the new expression, and will also include any embedded queries, aggregations and cube lookups. Validation occurs to ensure you aren't adding too many queries/cubes for the expression. This development supports the creation of complex expressions and allows you to test part of an expression before then adding it into another.
Modelling
Improved Behavioural modelling: selector variables for recency
Behavioural models allow you to select a lookalike audience using time-based behavioural data. You can aggregate a person's recent transactions and identify behavioural features that are indicative of the audience being targeted. These features are typically RFV-based aggregations such as the "count of purchases in the last year" or the "most recent donation value".
Whilst you could already create recency features from numeric variables (e.g. cost of last booking), this new development means you can also use selector variables (e.g. destination of last booking). Consequently, you can create more powerful models and more targeted campaigns, since the category associated with a person's recent behaviour is often very predictive.
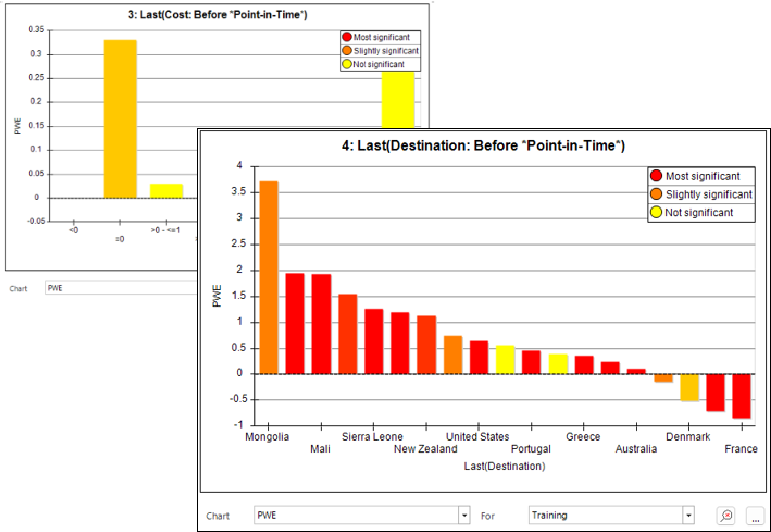
See Behavioural modelling - creating recency dimensions using selector variables
System improvements
Improved Legacy admin pages removed from web service
The legacy 'admin' pages, including FileUpload.aspx, have been removed from the FastStats Web Service. This improves security and reduces maintenance of outdated functionality.
Improved FastStats backup count reduced to 3
The default number of backups for new systems in the FastStats Service has changed from 10 to 3. This reduces storage usage and minimises the need for administrators to adjust the setting when creating new systems.
Improved Optimised distributed processing for cached cubes
Distributed processing now efficiently detects and utilises cached cube objects, improving query performance. If a cube is already cached, it will no longer be sliced, allowing the system to retrieve the cached version for faster results.
Additionally, a new currentTime parameter has been added to requests. This provides a reference time for slicing queries and cubes, reducing reliance on the todayAt parameter and improving consistency.
Improved Faster directory listing on high-latency systems
FastStats and PeopleStage now scan files in parallel when retrieving a directory listing, significantly reducing load times. This improvement is especially beneficial for systems with a large number of files stored on high-latency network drives.
Bug fixes
- Expressions
- Fixed a bug related to ?N wildcards with pattern match numeric values when they are missing.
- Fixed a bug related to pattern match numeric values with * elements.
- Fixed an issue where saved pattern match aggregations of the Longest Particular type behave incorrectly after reload.
- Fixed a crash issue with pattern match numeric sequences returning start/Nth/end transaction values.
- Fixed a bug related to order span and transactional table for pattern match numerics containing *.
- Fixed an issue where the percentile parameter was not sent to the server for expressions statistics.
- Fixed an issue where the TrimList function returns empty if trimming 0 items.
- Fixed a crash issue with ZScore expressions when the test and control are both 1.
- Fixed an issue relating to an incorrect error message displaying for DaysInMonth.
- Fixed a typo in the expression help for the StrStreak function.
- Venn
- Fixed an issue where irrelevant statistics are displayed.
- Fixed an issue where you cannot define a percentile statistic on an expression.
- Segmentation
- Fixed an issue where irrelevant statistics are displayed.
- Map
- Fixed an issue where right-dragging a statistic results in a crash.
- Cube
- Fixed an issue where clicking on custom colours before creating a cube causes a crash.